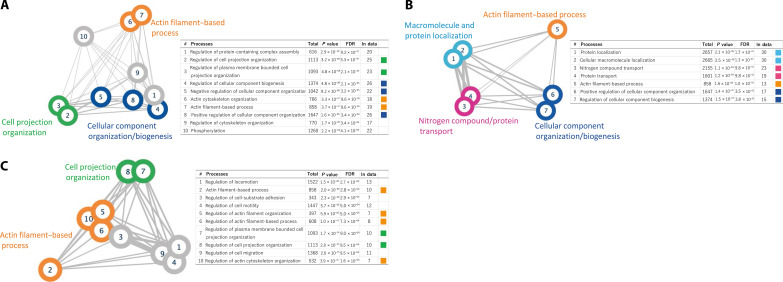
Fig. 4. Pathway analysis of genes expressing different major isoforms in different regions of the brain.
When more than 10 pathways are detected, the top 10 pathways with the smallest FDR are shown. Edge thickness is proportional to the number of related genes shared among pathways. (A) Pathway analysis results for genes with different major isoforms expressed in the cerebellum and hypothalamus. (B) Pathway analysis results for genes with different major isoforms expressed in the cerebellum and temporal cortex. (C) Pathway analysis results for genes with different major isoforms expressed in the hypothalamus and temporal cortex.

