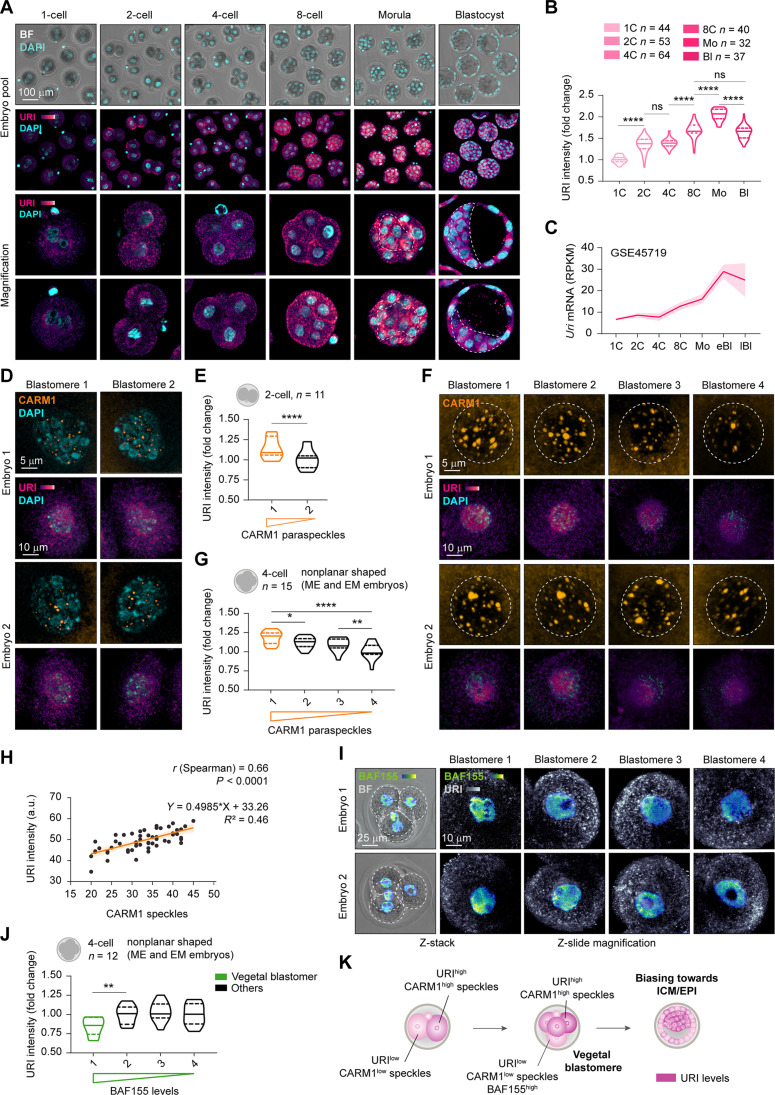
Fig. 1. URI concurs with blastomere pluripotency bias in the early mouse embryo.
(A) Immunofluorescence (IF) of URI in murine preimplanted embryos at different time points of embryonic development. Bottom represents magnifications for single embryo; dotted lines indicate ICM compartment. Scale bar, 100 μm. BF, bright-field. (B) URI intensity across early murine development from (A). One-way analysis of variance (ANOVA; Tukey post hoc test); ****P < 0.0001; ns, nonsignificant. (C) Uri expression along murine preimplantation development from normalized RNA-seq dataset analysis. Data are represented as mean of pooled embryos ±95% confidence intervals. (D) IF of URI and CARM1 speckles in mouse 2C embryos. Scale bars, 10 and 5 μm. (E) URI intensity in high versus low CARM1 speckles in 2C blastomeres from (D). Paired t test; ****P < 0.0001. (F) IF of URI and CARM1 nuclear speckles in 4C embryos. Scale bars, 10 and 5 μm. (G) URI intensity in high versus low CARM1 speckles number from (F). Matched one-way ANOVA (Tukey correction); *P < 0.05, **P < 0.01, and ****P < 0.0001. (H) Linear regression and correlation analysis of URI and CARM1 speckles number in 4C embryos from (F). a.u., arbitrary units. (I) IF of URI and BAF155 in mouse 4C blastomeres. Scale bars, 25 and 10 μm. (J) URI intensity in high versus low BAF155 blastomeres from (I). Matched one-way ANOVA (Geisser-Greenhouse correction and Holm-Sidak post hoc test); **P < 0.01. (K) Scheme summarizing URI expression among blastomeres at early developmental stages. Total number of embryos is referred in each panel. Repository accession number for sequencing dataset analysis are indicated in respective panel and compiled in table S1. Mo, Morula embryo; eBl, early blastocyst embryo; lBl, late blastocyst embryo.

