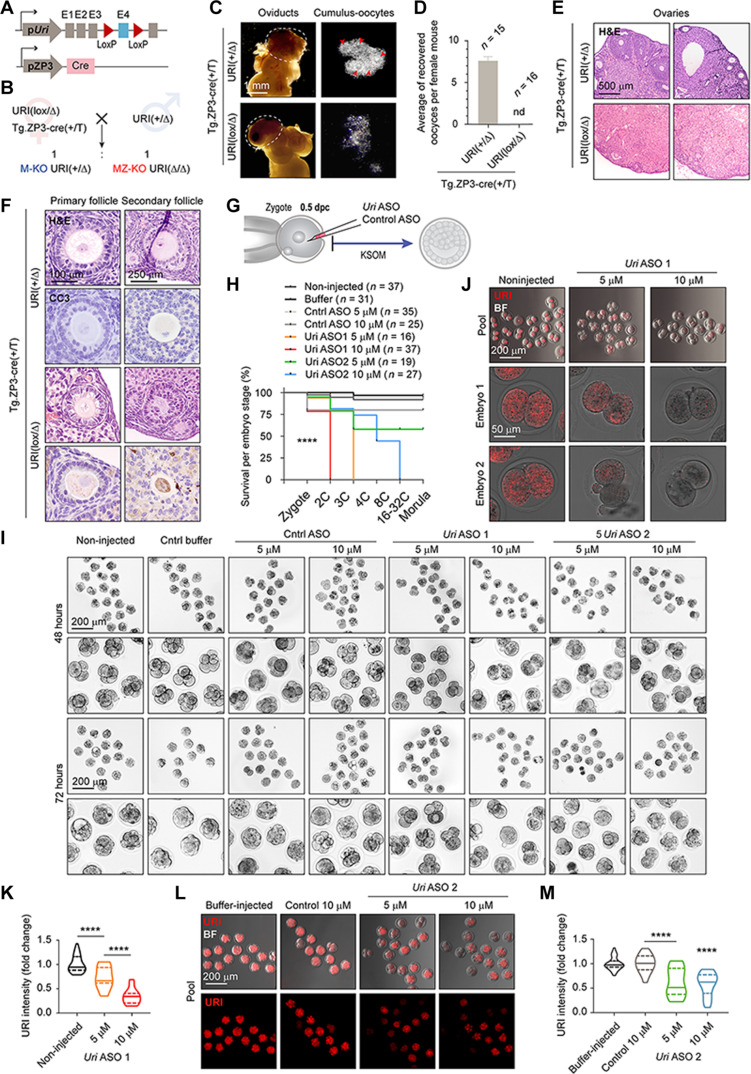
Fig. 4. URI is required for embryo development beyond totipotent 2C.
(A) Scheme of Uri maternal and zygotic ablation by crossing the oocyte-specific ZP3-Cre mice with the Uri lox mice. Uri maternal-zygotic knockout (MZ-KO) and maternal knockout (M-KO) embryos are generated. (B) Breeding strategy to generate Uri MZ-KO and M-KO embryos. (C) Representative BF images of ovaries and oviducts from referred genotype mice. Dashed lines depict ovaries. Arrowheads point zygotes. Scale bar, 1 mm. (D) Number of zygotes dissected from the ampulla region in the oviducts from panel (C). (E) Histological analysis by hematoxylin and eosin staining (H&E) of ovaries in maternal URI-depleted oocyte from (B). Scale bar, 500 μm. (F) Immunohistochemistry of cleaved caspase-3 (CC3) and histological analysis by H&E in primary and secondary ovary follicles from (E). Scale bars, 100 and 250 μm. (G) Scheme of zygote microinjection for targeting maternal and zygotic Uri mRNA with antisense-oligonucleotide (ASO). (H) Survival of embryos per preimplantation stage 72 hours after microinjection from (G). Mantel-Cox test; ****P < 0.0001. (I) Phase-contrast images for noninjected or buffer-microinjected, control ASO-microinjected (both 5 and 10 μM), and Uri ASO-microinjected (5 μM and 10 μM) embryos after 48 and 72 hours. Scale bars, 200 μm. Higher-magnification images are shown next to each condition. (J) IF of URI in Uri ASO1-microinjected embryos 72 hours after microinjection compared to noninjected 2C embryos. BF images are merged. Scale bars, 200 and 50 μm. (K) URI intensity in noninjected and Uri ASO1-microinjected embryos normalized to fold change. One-way ANOVA test (Tukey correction); ****P < 0.0001. (L) IF of URI in Uri ASO2-microinjected embryos 72 hours after microinjection compared to buffer and 10 μM control-microinjected embryos. BF images are merged. Scale bars, 200 μm. M, URI intensity in Uri ASO2-microinjected embryos normalized to fold change. One-way ANOVA test (Tukey correction); ****P < 0.0001. Total number of embryos is referred in each panel.

