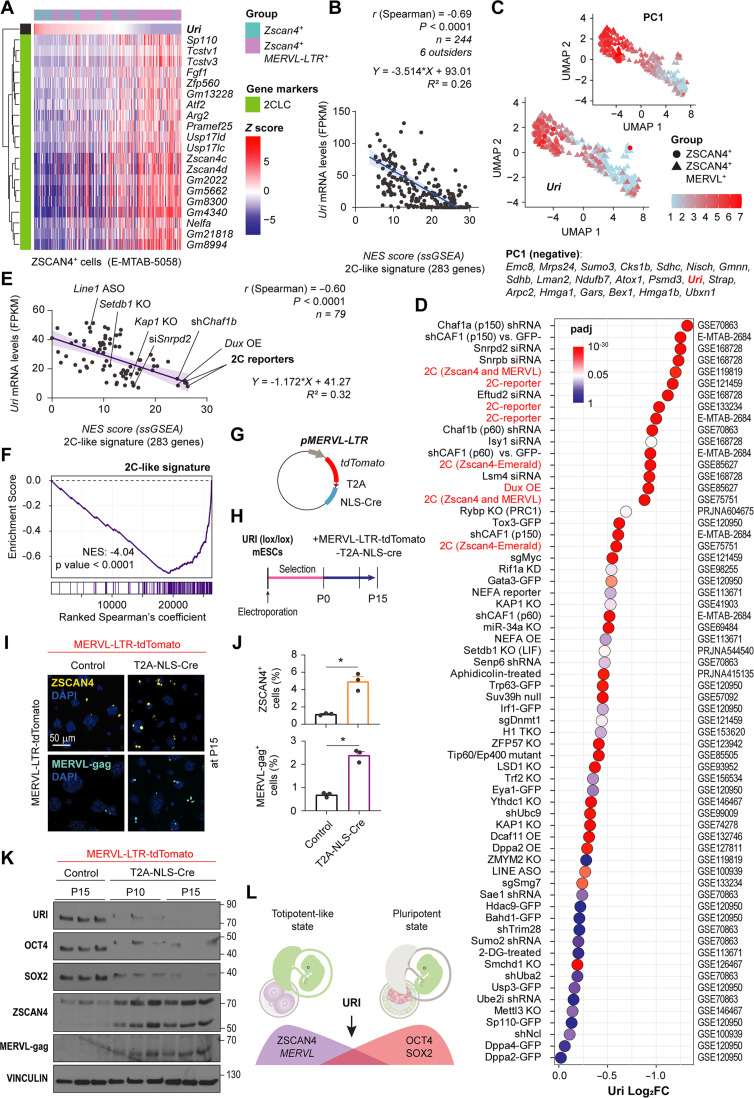
Fig. 6. Uri low marks 2C-like state.
(A) Heat map showing Uri-ranked mRNA expression of totipotent-like marker genes from scRNA-seq datasets. (B) Linear regression and correlation analysis between normalized Uri mRNA levels and NES of GSEA for 2C-like signature. Data are depicted as mean ± 95% confidence intervals. (C) UMAP plot depicting Zscan4+ and Zscan4+; MERVL-LTR+ scRNA-seq. Color lookup table renders normalized Uri expression. Uri is algorithmically identified as part of the PC1, also displayed. (D) Dot plot for differential expression analysis of Uri across multiple 2C-like cells, ERV activating, or sorted reporter models. Color depicts significance from P-adjusted (q) values white centered at 0.05 value. (E) Linear regression and correlation analysis showing the negative correlation between normalized Uri mRNA levels and NES of GSEA with 2C-like signature for totipotent-like models in (D). Data are depicted as mean ± 95% confidence intervals. (F) GSEA for 2C-like signature for ranked gene correlation with Uri across models from (D). (G) Plasmid construct for depleting URI in 2C-like cells under the MERVL-LTR promoter. (H) Timeline for URI depletion in totipotent-like cells by electroporating plasmid from (G). (I) IF of the totipotent-like marker ZSCAN4 or MERVL-gag in long term culture 2C-like dependent URI-depleted mESCs from (H). Scale bar, 50 μm. (J) Abundance of 2C-like cells after 15 passages from panel (I). t test analysis; *P < 0.05. (K) WB of post-electroporated mESCs at indicated number of passages as reported in (H). (L) Scheme representing the pluripotent state with URI expression opposed to the totipotent-like state. Repository accession number for sequencing dataset analysis are indicated in respective panel and compiled in table S1. Gene signature lists are arranged in table S2.

