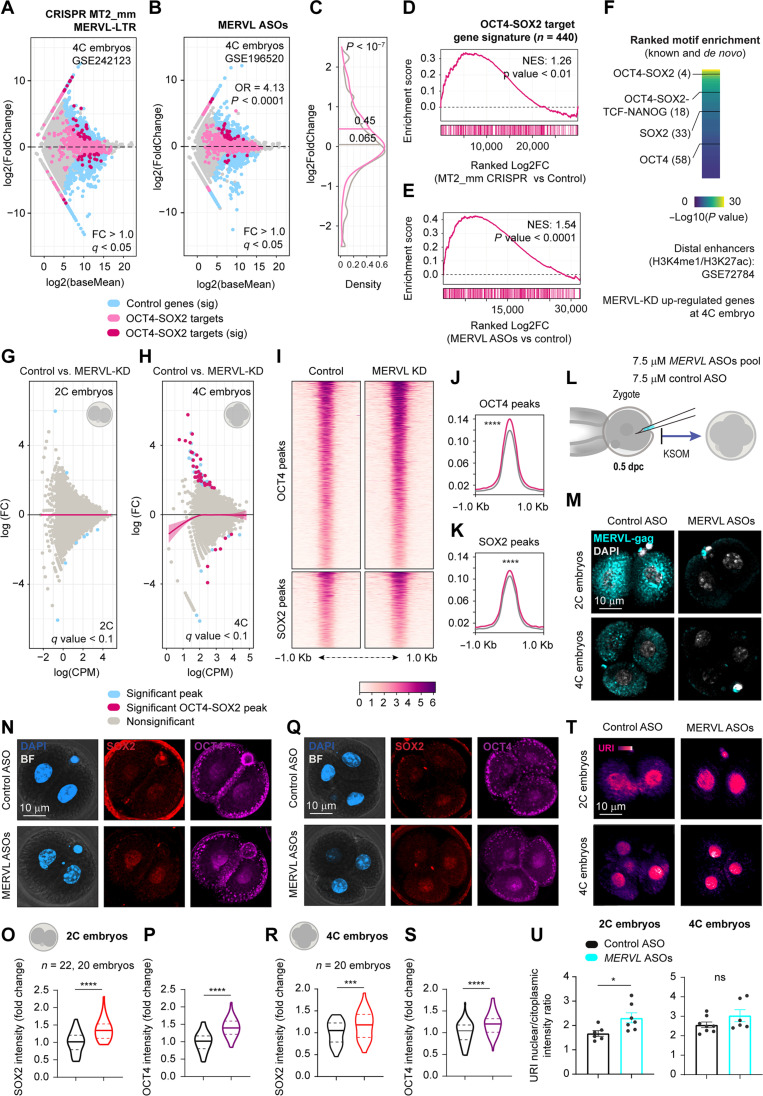
Fig. 8. MERVL controls pluripotent core factors levels.
(A and B) Differential gene expression of MERVL-LTR knockout (A) and MERVL knockdown (KD) (B) 4C embryos. Fisher’s exact was calculated for general and OCT4-SOX2 target genes. ****P < 0.0001. (C) Density plot of gene expression distribution from (B). t test; ****P < 0.0001. (D and E) Gene enrichment analysis for OCT4 and SOX2 target genes from A (D) and B (E). (F) Motif enrichment in proximal and distal enhancers of up-regulated genes from (B). (G and H) MA plot for differentially accessible regions from ATAC-seq in 2C (G) and 4C (H) embryos. Lines are loess fits to each distribution with 95% confidence intervals. (I) Heatmap for normalized ATAC-seq reads from MERVL KD 4C embryos for OCT4 and SOX2 binding regions. Peaks are scaled within 1-kb window. (J and K) Density plots of coverage for OCT4 (J) and SOX2 (K) from (I). Wilcoxon rank-sum test (Benjamini-Hochberg correction); ****q < 0.0001. (L) Scheme of zygote microinjection for targeting MERVL mRNA. (M) IF of MERVL-gag in 2C embryos from (L). Scale bar, 10 μm. (N) IF of OCT4 and SOX2 in 2C embryos from (L). Scale bar, 10 μm. (O and P) Intensity of SOX2 (O) or OCT4 (P) per blastomere nucleous from (N). t test; ****P < 0.0001. (Q) IF of OCT4 and SOX2 in 4C embryos from (L). Scale bar, 10 μm. (R and S) Intensity of SOX2 (R) or OCT4 (S) per blastomere nucleous from (Q). t test; **P < 0.01; ns, nonsignificant. (T) IF of URI in microinjected 4C embryos from (L). Scale bar, 10 μm. (V) URI nuclear/cytoplasmic intensity in 2C (left) or 4C (right) embryos from (T). t test; *P < 0.05. Total number of embryos is referred in each panel. Repository accession number for sequencing dataset analysis are indicated in respective panel and compiled in table S1. Gene signature lists are arranged in table S2.

