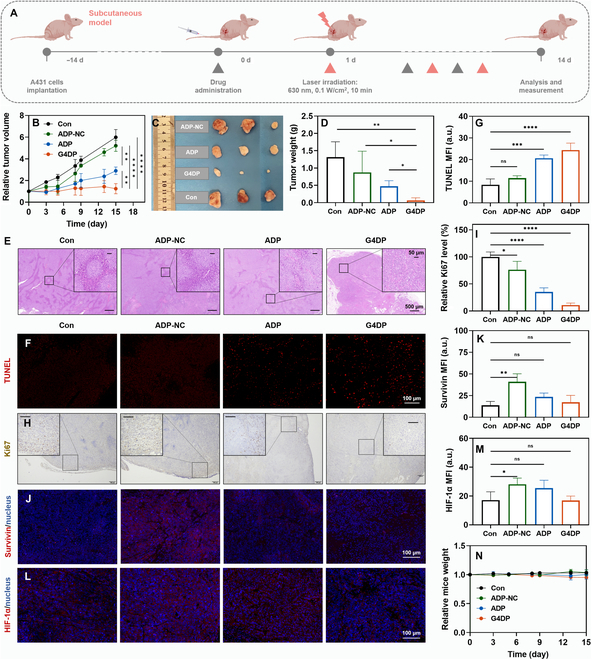
Fig. 6.

Antitumor effect of G4DP in xenograft tumor-bearing mice model. (A) Schematic depiction of the experimental approach for the antitumor treatment. (B) Tumor growth curves of different groups. (C) Photos of tumors harvested from mice in each group on day 14. (D) Tumor weight after various treatments. (E) Images of H&E staining for tumors after different treatments. Scale bar = 500 and 50 μm (inset), respectively. (F) Immunofluorescence staining of TUNEL (red) in tumor tissue and (G) the mean fluorescence intensity results. Scale bar = 100 μm. (H) Immunohistochemical staining of Ki67 in tumor tissue and (I) the relative quantified results. Scale bar = 100 and 50 μm (inset), respectively. (J) Immunofluorescence staining of Survivin (red) in tumor tissue and (K) the mean fluorescence intensity results. Scale bar = 100 μm. (L) Immunofluorescence staining of HIF-1α (red) in tumor tissue and (M) the mean fluorescence intensity results. Scale bar = 100 μm. (N) The relative mice weight of mice after different treatments. *P < 0.05, **P < 0.01, ***P < 0.001, and ****P < 0.0001.
