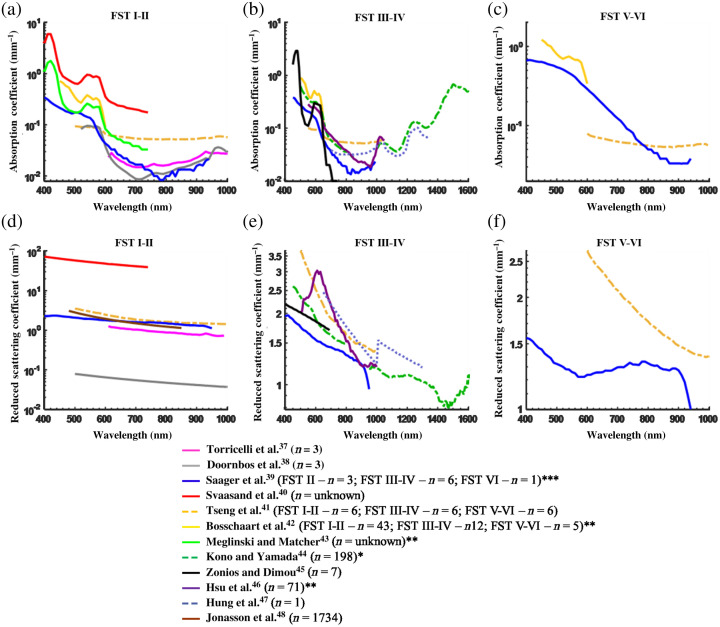
Fig. 4.
Variability in absorption coefficients (a)–(c) and reduced scattering coefficients (d)–(f) among the published in vivo data with skin type. The number of subjects measured for each publication is shown as “.” *Note that the data from Kono and Yamada44 were converted to reduced scattering using an average taken from the publications of 0.84. **Data from forearm unavailable. ***Note that data measured by Saager et al.39 for FST III and FST IV have been averaged to provide an FST III–IV measurement. Due to the reduced scattering scale distortion introduced by outliers, we point out that the distribution of reduced scattering data from Saager et al.39 ranges from 2.27 to , 1.94 to , and 1.56 to for FST I–II, III–IV, and V–VI, respectively.

