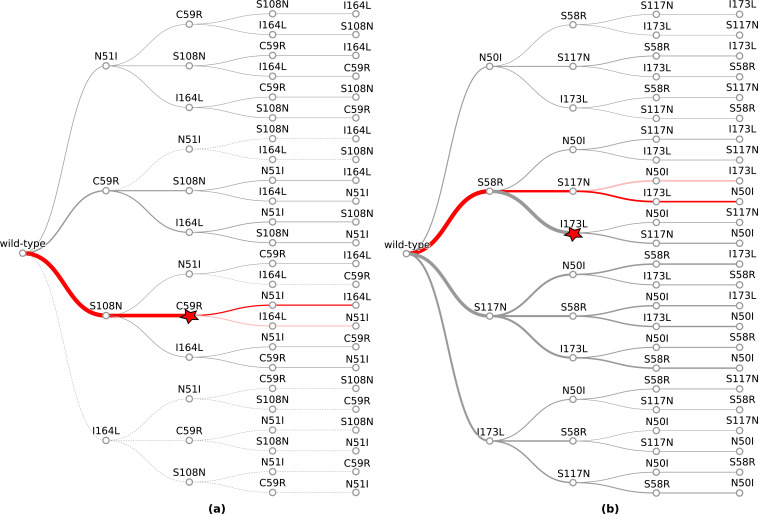
Figure 1. The probability of simulated evolutionary pathways to quadruple mutations (a) N51I,C59R,S108N,I164L in P. falciparum dihydrofolate reductase (PfDHFR) and (b) N50I,S58R,S117N,I173L in P. vivax DHFR (PvDHFR).
Line thickness indicates the total probability of a mutation when considering all pathways it can occur in, determined from the frequency of that step in all realised mutational pathways from all runs. Dotted lines indicate zero probability of a mutation at that step. The most likely pathway in total is denoted by a red star. The most likely pathway to the quadruple mutation is highlighted in dark red and the second most likely pathway to the quadruple mutation is highlighted in lighter red. The probabilities corresponding to these plots can be found in supplementary files ‘PfDHFR_total_pathway_probabilities.csv’ and ‘PvDHFR_total_pathway_probabilities.csv’ on Zenodo for (a) and (b), respectively.

