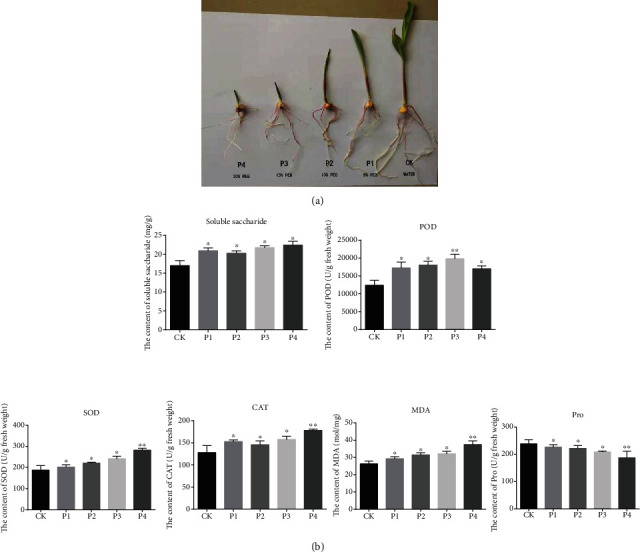
Figure 1.

The effects of polyethylene glycol- (PEG-) induced drought stress in maize. (a) Control: seeds at control media (without PEG). P1: 5% PEG-induced drought on root developments. P2: 10% PEG-induced drought on root developments. P3: 15% PEG-induced drought on root developments. P4: 20% PEG-induced drought on root developments. (b) The effect of PEG treatment on the content of soluble saccharide, POD, SOD, CAT, MDA, and protein. The asterisk represents the standard deviation. Bar graph with different asterisk indicates significant difference between the mean values (p ≤ 0.05).
