Figure 2.

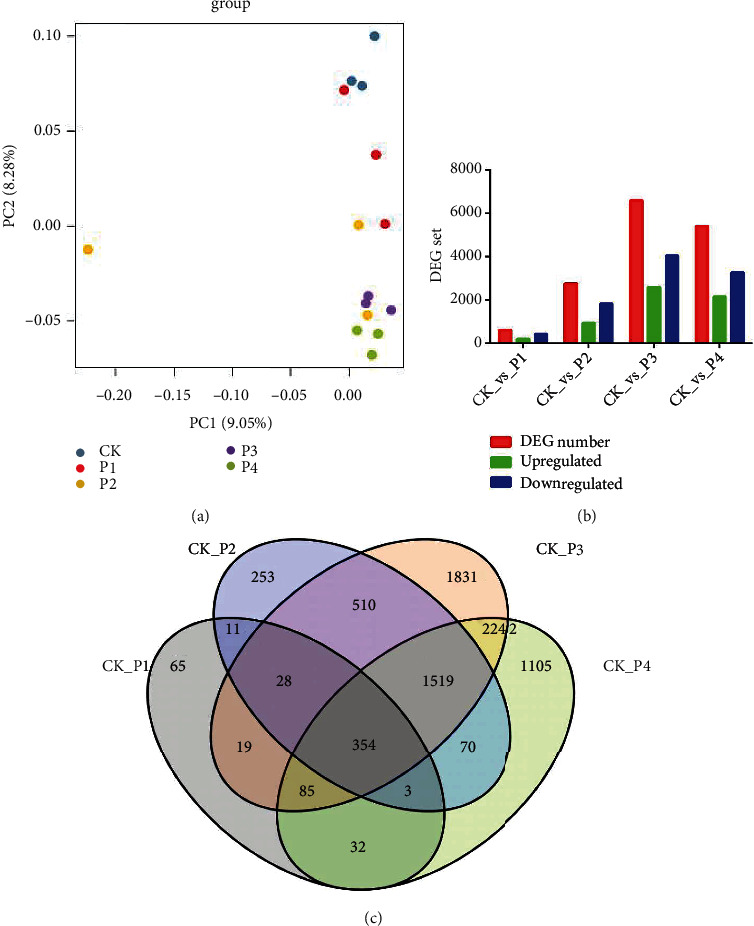
DEGs analysis. (a) PCA plot of PEG-induced drought stress in maize. (b) Expression patterns of the DEGs. (c) The Venn diagram showing the comparison of DEGs expressed at each comparison group.

DEGs analysis. (a) PCA plot of PEG-induced drought stress in maize. (b) Expression patterns of the DEGs. (c) The Venn diagram showing the comparison of DEGs expressed at each comparison group.