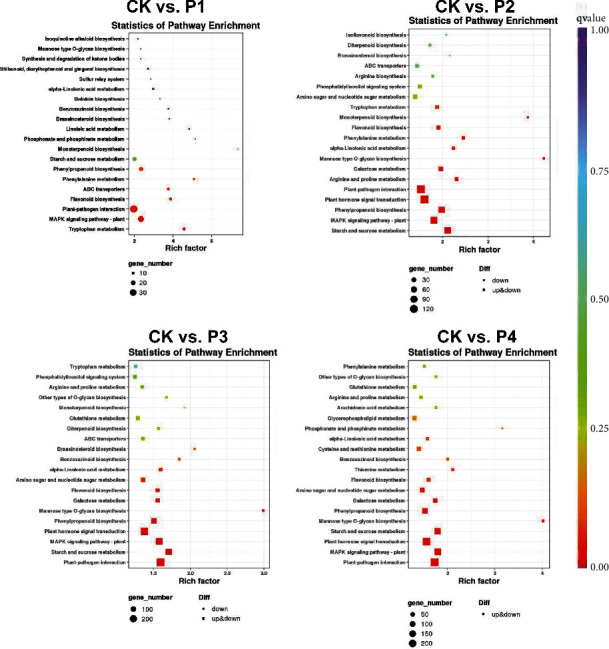
Figure 3.

KEGG pathway enrichment analysis of the DEGs after 5% PEG, 10% PEG, 15% PEG, and 20% PEG drought treatment, respectively. The experimental comparisons were based on the hypergeometric test, while the significance of the enrichment of the KEGG pathway is based on the q value (q < 0.05). The “rich factor” shows the DEG ratio to the total gene number in specific pathways.
