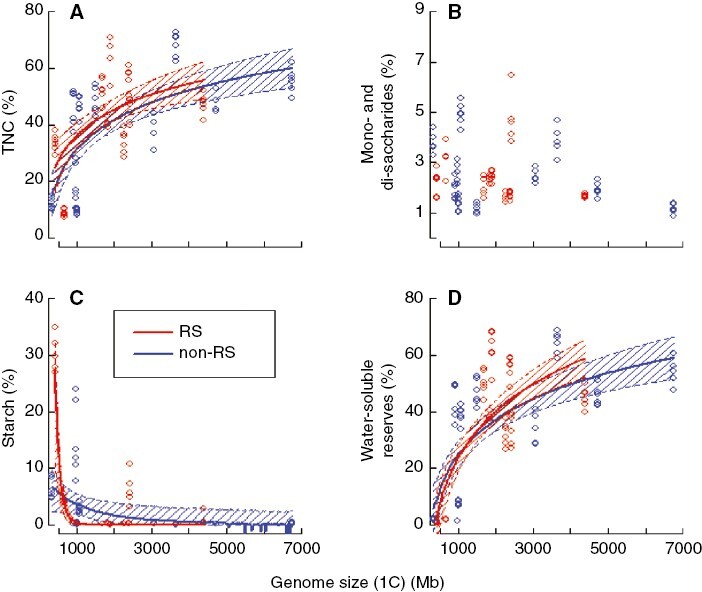
Fig. 2.

Carbohydrate concentrations plotted against species genome size (1C value). Fitted models and their 95 % confidence intervals for root (RS) and non-root (non-RS) sprouters are indicated (n = 111). (A) Total non-structural carbohydrates (TNC), (B) mono- and disaccharides (glucose, fructose and saccharose), (C) starch and (D) water-soluble reserves, i.e. mainly fructans + raffinose family oligosaccharides (RFOs) and sugar alcohols. Estimated models (merged for both non-root and root sprouters): TNC = −64.8 + 14.2 ln(GS), Starch = 35.3 (1 − 0.002)GS, WSR = −112.4 + 19.8 ln(GS), where ln = natural logarithm, GS = genome size and WSR = water-soluble reserves. Fitted lines are not plotted for the relationships that were not significant (P > 0.05); all significant relationships displayed P < 0.001.
