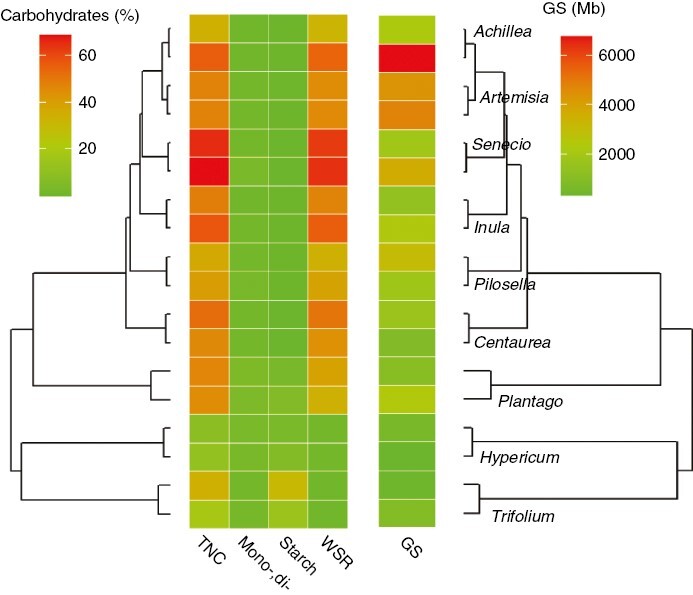
Fig. 3.

Carbohydrate concentrations (average species values) and genome size (1C value) mapped on the species phylogeny. Average carbohydrate pools were highly correlated with concentrations at the species level (r > 0.82 in all cases), and therefore they are not shown to reduce overplotting. TNC = total non-structural carbohydrates, mono-, di- = mono- and disaccharides (glucose, fructose and saccharose), WSR = water-soluble reserves, i.e. mainly fructans + raffinose family oligosaccharides (RFOs) and sugar alcohols, and GS = genome size.
