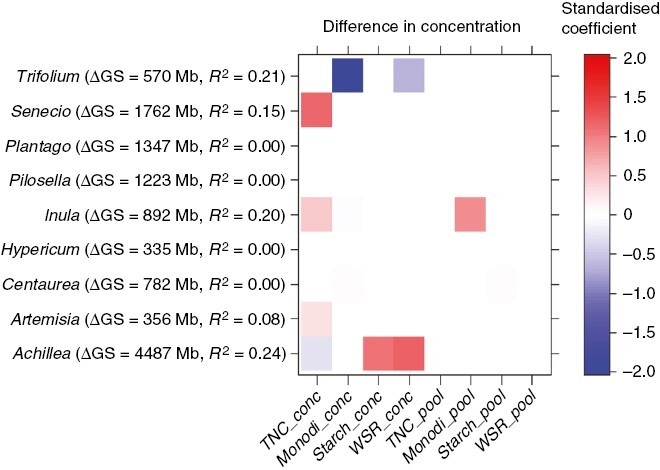
Fig. 4.

Heatmap showing differences in carbohydrate concentrations and pools between pairs of congeners. Standardized coefficients indicate significant differences (based on multivariate linear models, P < 0.05) of the congener with larger genome from the congener with smaller genome. ∆GS = genome size difference between congeners (Mb), R2 = Hooper’s coefficient of determination of the multivariate linear model, TNC = total non-structural carbohydrates, Monodi = mono- and disaccharides (glucose, fructose and saccharose), WSR = water-soluble reserves, i.e. mainly fructans + raffinose family oligosaccharides (RFOs) and sugar alcohols.
