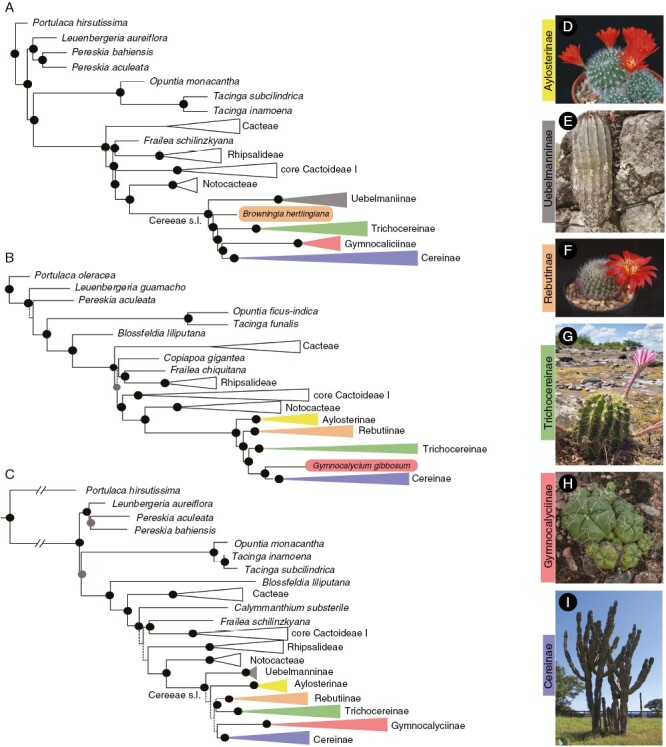
Fig. 2.

Phylogenetic tree reconstructions showing major clades of subfamily Cactoideae and tribe Cereeae from coalescent-based inference of the Cactaceae591 dataset (A), coalescent-based inference of the Angiosperm353 dataset (B) and maximum-likelihood inference of the gene-scale dataset (C). Highly supported branches (LPP > 0.9 for coalescent-based inference and BS/SH-aLRT > 95/80 for maximum-likelihood inference) are depicted with black circles; moderately supported branches (0.9 > LPP > 0.7 for coalescent-based inference and 95 > BS and 80 < SH-aLRT for maximum-likelihood) are depicted with grey circles. Low supported nodes (LPP < 0.7 in coalescent-based inference and BS/SH-aLRT < 95/80 in maximum-likelihood inference) are represented by dashed branch lines. Representatives of Cereeae clades: (D) Aylostera fiebrigii, (E) Uebelmannia pectinifera Buining, (F) Rebutia minuscula K.Schum, (G) Echinopsis sp., (H) Gymnocalycium denudatum (Link & Otto) Pfeiff. ex Mittler, (I) Cereus jamacaru DC. Photo credits: D and F: M. Lowry; E: E. M. Moraes; G and H: M. Kohler; and J: M. Romeiro-Brito.
