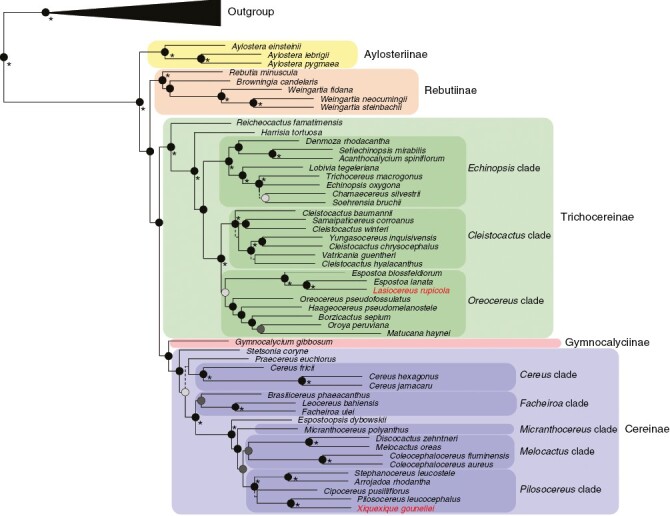
Fig. 5.

Phylogenetic tree reconstruction of coalescent-based inference using the Cactaceae591 dataset, highlighting the relationships within subtribe Cereinae. Highly supported branches (LPP > 0.95) are depicted by black circles at nodes. Nodes with LPP = 1 are highlighted with an asterisk. Moderately supported branches (0.95 > LPP > 0.8) are depicted by dark grey circles. Low supported nodes (LPP < 0.7) are shown with dashed lines in respective branches.
