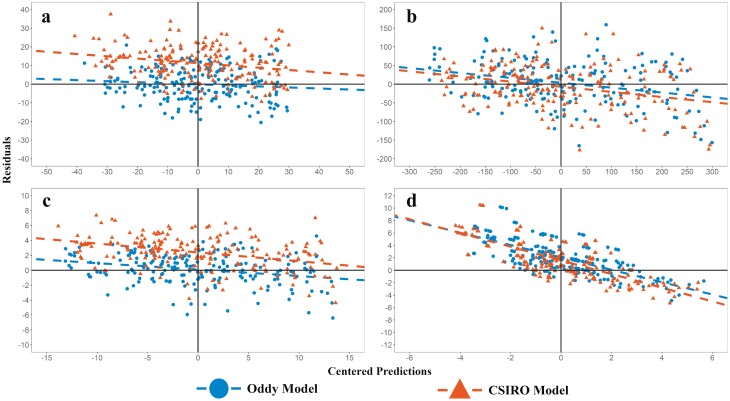
Figure 8.
Comparison of model and CSIRO model predictions v’s observed for the development data shown in Table 1. The graphs are residuals vs. centered predictions for (a) Protein in fleece-free EBW (MJ), (b) Fat (MJ), (c) fleece-free EBW (kg), and (d) Clean wool growth (g/d).

