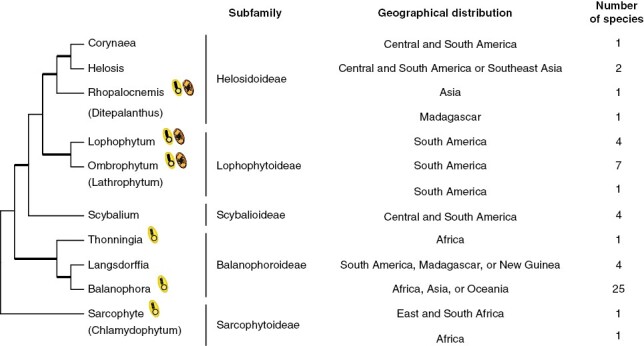
Fig. 2.

Phylogeny and features of Balanophoraceae. Maximum-likelihood phylogenetic tree based on a concatenated alignment of nuclear (rDNA operon) and mitochondrial (matR) sequences. No molecular data are available for Ditepalanthus, Lathrophytum or Chlamydophytum. Thick and thin branches indicate strongly or weakly supported relationships with bootstrap support values above or below 90 %, respectively. Details of the phylogenetic analysis are shown in Supplementary Data Figure S1. The availability of organellar genomic resources of holoparasites is indicated by a schematic plastid (in yellow) or mitochondrion (in orange). The geographical distribution and number of species was taken from https://powo.science.kew.org/.
