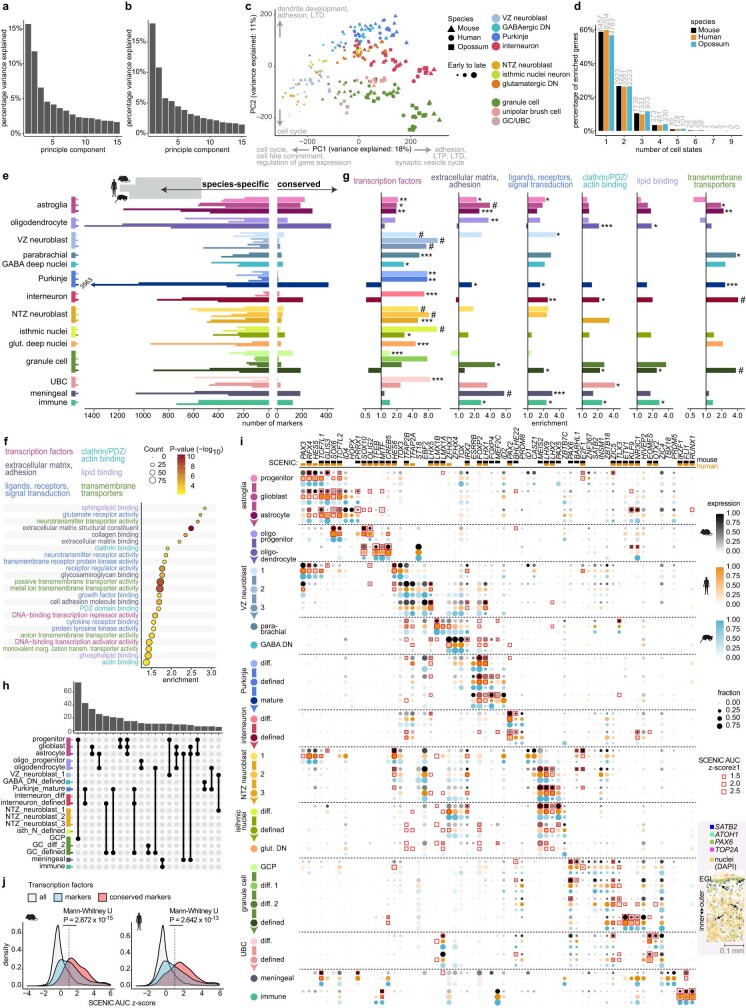
Extended Data Fig. 8. Transcriptional programs and marker genes.
a,b, The percentage of variance explained by the first 15 principal components in the global PCA (a) and in the PCA of neurons only (b). c, PCA of neuronal cells based on 10,276 expressed orthologous genes across the three species. Data points represent cell-type pseudobulks for each biological replicate. Examples of enriched gene ontology and pathway categories for the genes loaded to PC1 and PC2 are indicated. d, Number of cell states in which genes show expression enrichment in mouse, human and opossum. e, Numbers of species-specific and conserved cell state markers among 1:1:1 orthologous genes. f, Enriched gene ontology molecular function categories among the conserved markers. Terms are grouped into broad categories as indicated by the colours. g, Representation of the broad molecular function categories among the conserved markers of individual cell states. Enrichments were identified using one-sided hypergeometric tests against a background of all 1:1:1 orthologous genes detected in the cell states included in the analysis; P values were adjusted for multiple testing using Benjamini-Hochberg method; *P < 0.05, **P < 10−2, ***P < 10−3, #P < 10−6. h, Shared conserved markers are typically found in states closely related in terms of cell type lineage or maturation status. All groups with more than 5 genes are shown. i, Expression and regulon activities of transcription factors that are among the conserved markers, across cell states in mouse (black), human (orange) and opossum (blue). Dot size and colour intensity indicate the fraction of cells expressing each gene and the mean expression level scaled per species and gene, respectively. Colours on top mark the transcription factors for which regulons (i.e. co-expression modules that are retained after pruning for the presence of transcription factor motifs in promoter areas) were built by SCENIC in mouse (black) or human (orange) datasets. Note that activities of individual transcription factors modelled by SCENIC can be compared across cell states but not across species, given that the regulons were built separately for human and mouse. Red rectangles denote high regulon activities (standardized activity score ≥1). For each cell state four highest-ranking transcription factors are shown. Inset shows smFISH signal of SATB2 in granule cell lineage cells (PAX6) in 12 wpc human cerebellum. Arrows denote examples of cells co-expressing SATB2 and PAX6. j, Distribution of standardized regulon activity scores in mouse or human cell states for all transcription factors (grey), marker transcription factors (blue), and conserved marker transcription factors (red). Only transcription factors for which regulons were built by SCENIC are included (mouse n = 447, human n = 499). Scores ≥1 (vertical line) were defined as “high”. P values are from two-sided Mann-Whitney U tests. EGL, external granule cell layer; LTD, long-term depression; LTP, long-term potentiation; PCA, principal components analysis.

