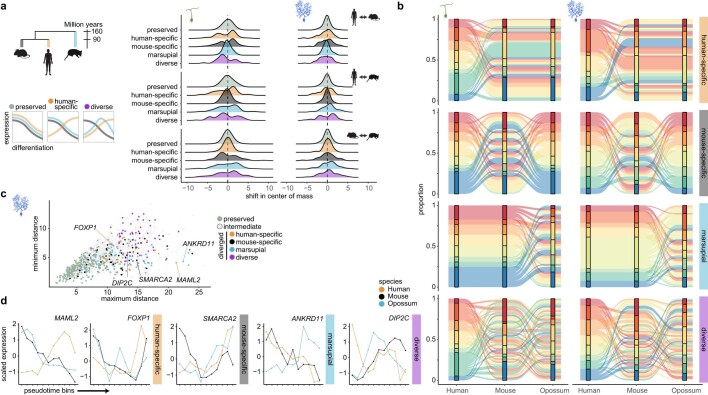
Extended Data Fig. 10. Gene expression trajectories across neuronal differentiation.
a, Distribution of the pairwise (human versus mouse, human versus opossum, mouse versus opossum) shifts in the center of mass values of the trajectories that were assigned to preserved, human-specific, mouse-specific, marsupial and diverse patterns groups. The scheme (right) shows examples of a preserved pattern, a change in the human lineage, and a diverse pattern that cannot be assigned to a lineage. The changes in genes that differ between eutherians and opossum (marsupial) cannot be polarized. b, Distribution between trajectory clusters for genes with changes in gene expression trajectories during granule cell (left) or Purkinje cell (right) differentiation. c, Scatter plot of minimum and maximum pairwise distances between the expression trajectories of orthologues from the three species in Purkinje cell differentiation. High maximum and low minimum distances indicate the strongest lineage-specific trajectory changes. d, Examples of genes that display cross-species differences in trajectories during Purkinje cell differentiation.

