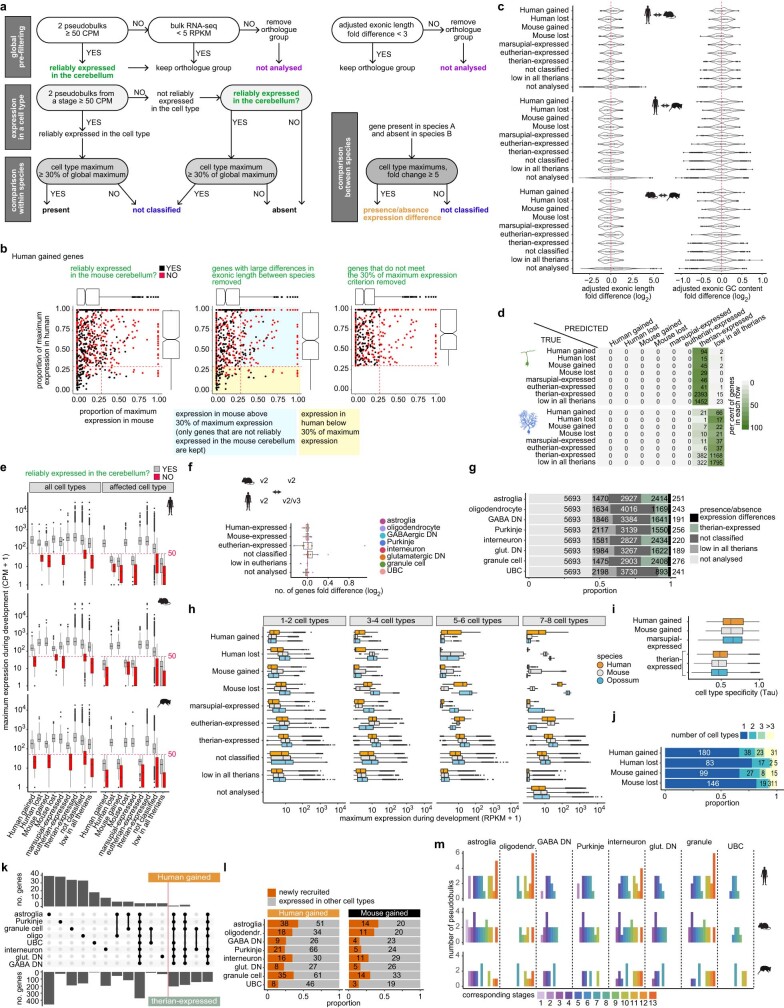
Extended Data Fig. 11. Presence or absence expression differences between species.
a, Scheme on classification of presence or absence expression differences. b, Visualization of filtering steps for human gains. The plots show the ratio between the gene’s maximum expression within a cell type and the maximum expression of the same gene across all cell types in mouse (x axis) and human (y axis). The red lines indicate the 30% threshold. Initial calls (left), calls after filtering out the genes with large differences in exonic length (middle), and after additionally applying the 30% of maximum expression criterion (right). c, Median-adjusted fold difference in exonic length (left) and exonic GC content (right) across species for the genes in different categories assigned based on the presence/absence expression patterns in the cerebellar cell types in the three therian species. Genes below the threshold (<50 CPM) in all species are marked as low in all therians. d, Random forest model with exonic length and GC content as predictors are not able to predict the presence or absence expression differences between the species. Granule cell and Purkinje cell calls are shown. e, Distribution of expression levels for the genes in different presence/absence categories. Assignments from all eight main neural cell types are included (i.e., each gene is represented eight times). Maximum expression during development among all cell types (15 cerebellar cell types (Supplementary Information); left) or in affected cell type (right) is shown. f, Fold difference in the number of genes assigned to different presence/absence categories using Chromium v2 data only or including also v3 data. Subsets of human (v2/v3 or v2 only) and mouse (v2 only) datasets were used (Supplementary Information). g, Genes assigned to different categories in the presence or absence expression analysis of the three therian species. h, Comparison of cerebellar gene expression patterns in the snRNA-seq datasets to the bulk RNA-seq data19. Genes were assigned to groups based on the presence/absence expression patterns in the cerebellar cell types in the three therian species. Maximum expression across development, based on the bulk RNA-seq data, is shown. i, Cell type-specificity index (Tau) for the genes that are robustly expressed in a single species or all species. Data from all cell types are summarized. The index ranges from 0 (broad expression) to 1 (restricted expression). j, Number of cell types in which genes were called as having gained or lost expression in different phylogenetic branches. k, Number of genes assigned as human-gained or therian-expressed in different cerebellar cell types and their combinations. Ten cell type groups with the highest number of genes in the human-gained gene set (left from the red line) or therian-expressed gene set are shown. l, Number of human-gained and mouse-gained genes that were expressed in other cell types in the cerebellum or newly recruited to the cerebellar transcriptome. m, Number of cell type pseudobulk replicates used for expression plots in Fig. 4g,i and Extended Data Fig. 12a,d. In b,e,f,h,i, boxes represent the interquartile range, whiskers extend to extreme values within 1.5 times the interquartile range from the box, and line denotes the median.

