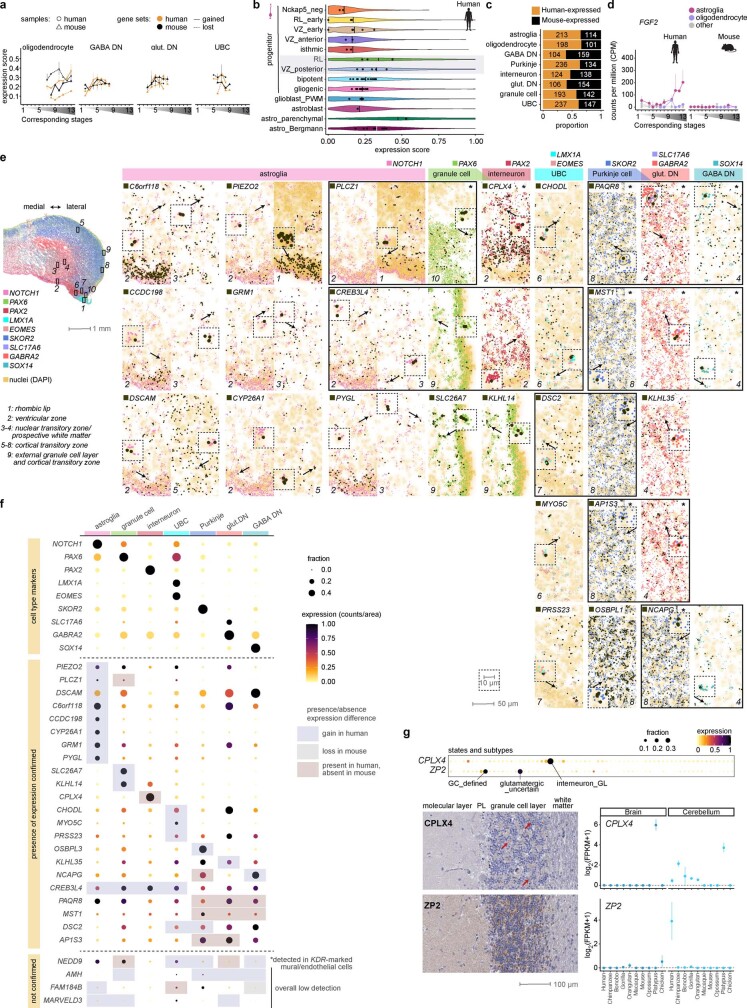
Extended Data Fig. 12. Expression patterns and spatial mapping of genes with presence or absence expression differences.
a, Expression of genes that were gained or lost in the human or mouse lineage in different cerebellar cell types across development. The expression of the genes that were lost in the human lineage were evaluated in the mouse samples, and vice versa. Stages are aligned across species as shown in Fig. 1a; the line indicates the median of biological replicates. b, Expression of genes that were gained in the astroglia in the human lineage across astroglia subtypes. The lines show the median of all cells and the dots show the median of each biological replicate that had at least 50 cells in the respective subgroup. c, Presence or absence expression differences between mouse and human cerebellar cell types. d, Example of a gene that shows a presence or absence expression difference between human and mouse astroglial cells. e, Human 12 wpc cerebellum smFISH data for genes with presence or absence expression differences between human and mouse. Asterisks denote expression changes that could not be polarized; other changes were assigned as gains in the human lineage. The locations of the regions 1–10 expanded at the right are shown with rectangles (solid line) on the whole section at the left. mRNA spots are black for the genes with differences, and coloured for the cell type markers. Arrows and insets show example cells where co-expression with the respective cell type marker(s) is detected. f, Quantification of the smFISH data in e. Cell type labels were transferred based on alignment83 of the segmented82 smFISH dataset with the 11 wpc snRNA-seq data (Fig. 1d). Expression levels (mRNA counts) were normalised to segment area and scaled. The cell types where a difference was called are highlighted for each gene. Out of the 26 genes tested, expression of 22 genes in the respective cell type(s) was confirmed by smFISH; 3 genes displayed overall low signal, and expression of one gene remained undetected in a cell type where the change was observed based on snRNA-seq data. g, Expression of ZP2 and CPLX4 in the human snRNA-seq dataset from this study (top), in human cerebellar sections as determined by immunohistochemistry (Human Protein Atlas)45 (left), and in the adult brain and cerebellum from nine mammals and chicken based on bulk RNA-seq data47 (right). The antibodies used for immunohistochemistry were HPA047627 (CPLX4) and HPA011296 (ZP2). Red arrows point to synaptic staining in the granule cell layer. For brain bulk RNA-seq, prefrontal cortex was sampled for primates, and whole brain, except cerebellum, was sampled for non-primates. GABA DN, GABAergic deep nuclei neurons; glut. DN, glutamatergic deep nuclei neurons; PWM, prospective white matter; RL, rhombic lip; UBC, unipolar brush cell; VZ, ventricular zone.

