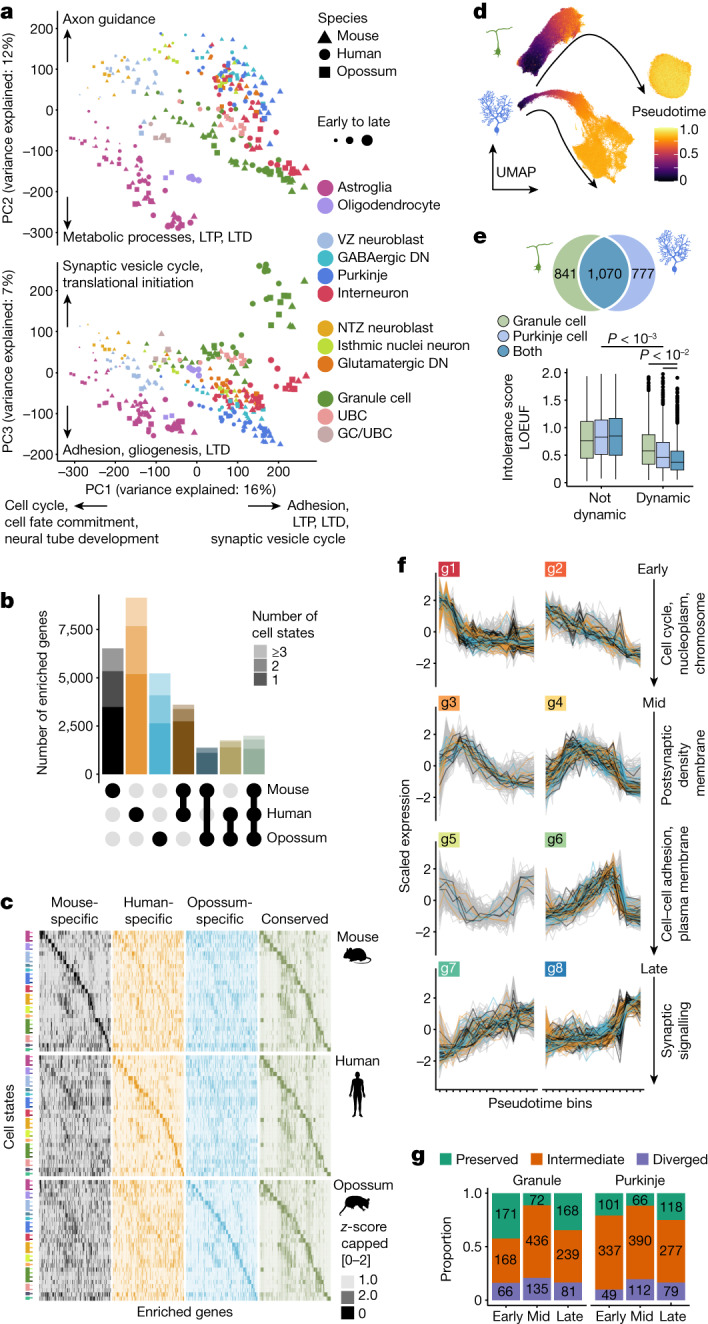
Fig. 3. Cell-type-defining transcriptional programmes.

a, Principal components analysis based on 10,276 orthologous genes expressed in all species. Data points represent cell-type pseudobulks for each replicate. Examples of enriched gene ontology terms and pathways for the genes loaded to principal components 1–3 are indicated. LTD, long term depression; LTP, long term potentiation; PC, principal component b,c, Numbers (b) and expression patterns (c) of species-specific and conserved markers. Twenty genes per state are shown in c. d, UMAPs of cells from granule cell and Purkinje cell lineages aligned across species and coloured by diffusion pseudotime values. e, Intolerance to functional mutations in human population (low values indicate intolerance) for genes dynamic or non-dynamic across differentiation of granule cells, Purkinje cells, or both neuron types in all species. Numbers of dynamic genes per category are indicated at the top. Boxes display interquartile range, whiskers extend to values within 1.5× interquartile range, and the line marks the median. Adjusted P values were calculated via two-sided permutation tests of pairwise comparisons between all categories. LOEUF, loss-of-function observed/expected upper bound fraction. f, Clusters (g1–g8) of gene-expression trajectories during granule cell differentiation, ordered from early to late differentiation based on the mean centre-of-mass values of the confident cluster members’ trajectories. Strongly preserved trajectories of the orthologues are highlighted. Examples of enriched gene ontology terms for the genes with preserved trajectories are shown for each row (excluding g5). g, Proportion of human genes with strongly preserved, intermediate and diverged trajectories in early, mid (excluding g5) and late clusters.
