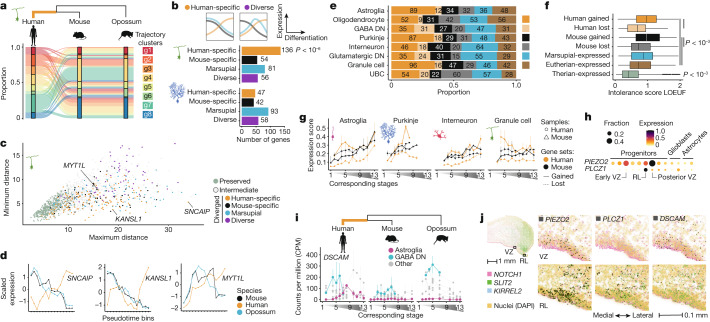
Fig. 4. Evolutionary change in gene expression.
a, Changes in gene-expression trajectories during granule cell differentiation assigned to the human lineage. b, Bottom, numbers of genes with trajectory changes in granule or Purkinje cells in different phylogenetic branches. Top, scheme illustrating a change in the human lineage and a diverse pattern. c, Minimum and maximum pairwise distances between the trajectories of orthologues from the three species. High maximum and low minimum distances indicate the strongest lineage-specific changes. d, Examples of genes that evolved a new trajectory during granule cell differentiation in the human lineage. e, Presence or absence expression differences assigned to different phylogenetic branches. f, Intolerance to functional mutations in human population (LOEUF) for genes grouped based on the presence or absence of expression. Values are summarized across the eight cell types. Boxes display interquartile range, whiskers extend to values within 1.5x interquartile range, and the line marks the median. Numbers of genes as shown in e and Extended Data Fig. 11g. g, Expression of genes with gained or lost expression in the mouse or human lineage in selected cell types across development. Genes that were lost in a species were evaluated in the other species. h,i, Examples of genes that gained expression in human astroglial cells. In h, dot size and colour indicate the fraction of cells expressing a gene and the scaled mean expression level, respectively. j, Co-expression of PIEZO2, PLCZ1 and DSCAM with NOTCH1 (progenitors), KIRREL2 (VZ) or SLIT2 (rhombic lip) in human 12 wpc cerebellum by smFISH. The expanded regions are indicated by rectangles on the main section (top left). g,i, stages are aligned across species as in Fig. 1a; line indicates the median and bars the range across pseudobulks (n shown in Extended Data Fig. 11m). b,f, Adjusted P values were calculated via two-sided binomial (b) or permutation tests of pairwise comparisons (f).

