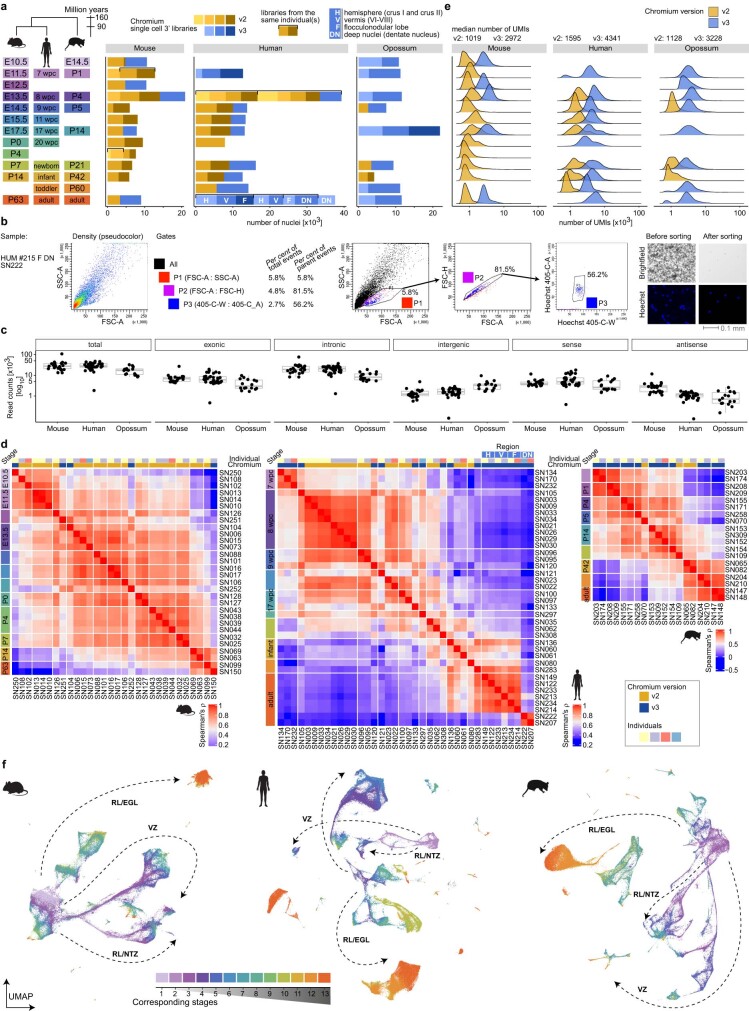
Extended Data Fig. 1. Overview of the datasets.
a, Number of cells profiled by snRNA-seq per stage in mouse, human and opossum. A schematic of the sampled stages is shown on the left. Colours in bar plots indicate individual libraries (Chromium v2 in yellow hues and v3 in blue hues). Samples from different individuals were used for each library, except for the libraries grouped with brackets. The sampled cerebellum region is indicated for human adult libraries. b, Example of gating strategy used for fluorescence-activated nuclei sorting. Nuclei were stained with Hoechst. To separate nuclei from the cellular debris the gates were set on FSC/SSC and at the excitation wavelength of 405 nm. Cell counter images before and after sorting are shown at the right. Sorting was applied to some of the adult human samples (Supplementary Table 1). c, Mapping statistics for the reads from mouse, human and opossum libraries. Shown are the total, exonic, intronic, and intergenic read counts per library based on the mature mRNA reference. Exonic counts are further split into sense and antisense read counts. Boxes represent the interquartile range, whiskers extend to extreme values within 1.5 times the interquartile range from the box, and line denotes the median. n(mouse) = 30, n(human) = 38, n(opossum) = 19. d, Spearman’s rho correlation coefficients across libraries in mouse, human and opossum datasets. UMIs counted in mature mRNA mode were aggregated across all cells in each library. Correlations were calculated using the ranks of CPM (counts per million) values of the expressed genes (genes expressed in at least 10% of cells in any pseudobulk; human n = 7,696; mouse n = 4,806; opossum n = 2,765) within each library. Libraries are grouped by developmental stage and Chromium version. The sampled cerebellum region is indicated for human adult libraries, as in a. e, Distribution of UMI counts in v2 and v3 libraries in mouse, human and opossum datasets. Median UMI counts are shown for each species and Chromium version. f, Uniform Manifold Approximation and Projection (UMAP) of 115,282 mouse, 180,956 human and 99,498 opossum cells coloured by their developmental stage. Colours indicate the matched stages as shown in panel a and Fig. 1a. The broad neuronal lineages are shown with arrows. EGL, external granule cell layer; NTZ, nuclear transitory zone; RL, rhombic lip; VZ, ventricular zone.

