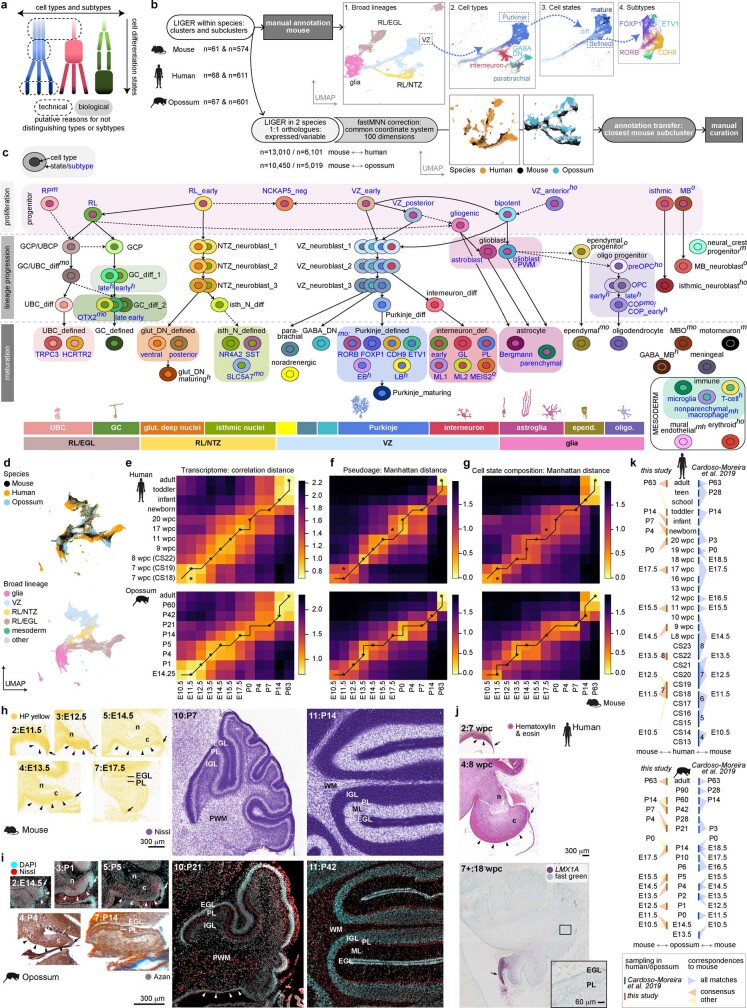
Extended Data Fig. 2. Cell type annotation and stage correspondences.
a, Schematic summary of the annotation strategy. We used the term “type” to group cells committed to a distinct cell fate, and “state” to refer to differentiation status that often form a continuum within each cell type category. Shown are three hypothetical cell types (colours) and their subtypes (rectangles). Note that the cell state categories do not necessarily align across cell types. Both biological and technical reasons could explain why subtypes cannot be distinguished across all states in a given cell type. b, Outline of the procedures used for cell type annotation of the mouse, human and opossum datasets. c, Overview of the cell type annotation categories. Schematic cells have their nuclei coloured by cell type and cytoplasm coloured by state or subtype. Cell state labels are in black, subtype labels in blue. Cell states at which subtypes were distinguished are highlighted with coloured background. For the categories not detected in all species, superscript text specifies the dataset(s) where a category is present: h, human; m, mouse; o, opossum. Solid arrows depict known lineage relationships, dashed arrows depict additional relationships suggested by our data. Broad cell type lineage groups are shown at the bottom. d, Integrated UMAP of mouse, human and opossum cells coloured by species or broad cell type lineage. We used 1:1 orthologous genes detectable in all batches and variable across cells (n = 3,742). e–g, Pairwise correspondences of developmental stages across species. The line indicates the best alignment between the time series determined by dynamic time warping algorithm using pseudobulk transcriptome correlation distances (e), Manhattan distances of pseudoages (f), and Manhattan distances of the cellular compositions at the level of cell states (g). Mouse was used as the focal species. Asterisks indicate the consensus stage correspondences from the three analyses. In e, we only used the genes that were informative in both datasets (intersect of overdispersed genes, human vs. mouse n = 336, opossum vs. mouse n = 369). h–j, Comparison of the developing cerebellum structures in mouse (h), opossum (i) and human (j). Mouse images are from the Allen Developing Mouse Brain Atlas15. The sagittal sections were stained with HP yellow or Nissl. For opossum, sagittal sections were prepared from E14.5-P21 heads and P42 cerebellum. Sections from fresh-frozen or FFPE samples were stained with DAPI and NeuroTrace Nissl, or with Azan, respectively. Human images are from the HDBR Atlas79–81. 7 wpc and 8 wpc (CS23) sagittal sections were stained with hematoxylin and eosin; LMX1A RNA was probed in the 18 wpc sagittal section, counterstained with fast green. Arrowheads indicate the cerebellar ventricular zone, arrows denote the rhombic lip, n and c label the NTZ and CTZ. The stages are numbered as in Fig. 1a. At E11.5/E14.5 (mouse/opossum) the cerebellar primordium is dominated by the cell-dense neuroepithelium. NTZ and CTZ are first visible at E12.5/P1 and E13.5/P4, respectively. EGL and developing PL are discerned at E17.5/P14. P7/P21 is characterized by a thick EGL, which shrinks but is still present at P14/P42. Similarly in human, at 7 wpc the cerebellar primordium is dominated by the cell-dense neuroepithelium; CTZ is visible at 8 wpc; EGL and PL are discerned at 18 wpc. Newborns are characterized by a thick EGL, which gradually shrinks but is still present in infants after 8 months of postnatal development103. k, Comparison of the sampling and stage correspondences in this study and in ref. 19. Human samples representing 4–8 wpc may include samples from several Carnegie stages. The correspondences estimated in both studies globally agree. The shifts are explained by differences in sampling, e.g. in this study 8 wpc in human is represented by CS22 and best matches to E13.5 in mouse, whereas in ref. 19 8 wpc stage group includes samples from CS22 to late 8 week and best matches to E14.5 in mouse. COP, committed oligodendrocyte precursor; def., defined; diff, differentiating; CS, Carnegie stage; CTZ (c), cortical transitory zone; DN, deep nuclei; E, embryonic/prenatal day; EB, early-born; EGL, external granule cell layer; GABA, GABAergic; GC, granule cell; GCP, granule cell progenitor; glut, glutamatergic; IGL, internal granule cell layer; isth N, isthmic nuclei neurons; L8, late 8th week; LB, late-born; MB, midbrain; MBO, midbrain-originating cell; ML, molecular layer; NTZ (n), nuclear transitory zone; oligo, oligodendrocyte; OPC, oligodendrocyte progenitor cell; preOPC, precursor of oligodendrocyte progenitor cell; P, postnatal day; PL, Purkinje cell layer; PWM, prospective white matter; RL, rhombic lip; RP, roof plate; UBC, unipolar brush cell; UBCP, unipolar brush cell progenitor; VZ, ventricular zone; WM, white matter; wpc, weeks post conception.

