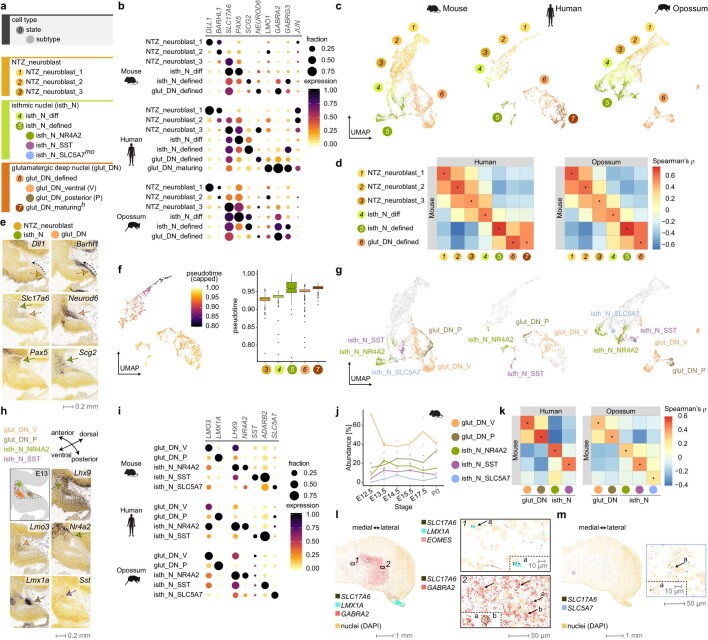
Extended Data Fig. 4. Atlas of the RL/NTZ cell types.
a, Cell types, states and subtypes of neurons born at the early rhombic lip and/or located at the nuclear transitory zone during development. For the categories not detected in all species, superscript text specifies the dataset(s) where a category is present: h, human; m, mouse; o, opossum. In human, we distinguished a LMO1-marked population of glutamatergic deep nuclei neurons that likely represents a more mature cell state (see b-f and l). b, i, Expression of key marker genes in the RL/NTZ cell states (b) or subtypes (i) in mouse, human and opossum. Dot size and colour indicate the fraction of cells expressing each gene and the mean expression level scaled per species and gene, respectively. c, g, Uniform Manifold Approximation and Projection (UMAP) of 10,949 mouse, 6,301 human and 9,965 opossum RL/NTZ cells coloured by their state (b) or subtype (g). Colours and numbers as in a. d, k, Spearman’s correlation coefficients between orthologous variable gene expression profiles from mouse, human and opossum cell states (d; n = 224 genes) or subtypes (k; n = 225 genes) in the RL/NTZ broad lineage. Dots indicate the highest correlation for each column. e, h, Spatial distribution of RL/NTZ cell states (e) or glutamatergic deep nuclei and isthmic nuclei subtypes (h) in mouse E13.5 cerebellar primordium based on RNA in situ hybridization data15 for marker genes. Sagittal sections counterstained with HP Yellow are shown. Coloured arrows indicate the domains expressing markers of the different cell type/state categories; dotted arrows show the direction of the migration from the rhombic lip to the NTZ. In h, a schematic summary is shown in the top left panel. f, UMAP of human RL/NTZ cells coloured by their pseudotime values, and distribution of pseuodotime values across cell state categories. Colours and numbers as in a. Boxes represent the interquartile range, whiskers extend to extreme values within 1.5 times the interquartile range from the box, and line denotes the median. j, Subtype relative abundances (median of biological replicates) across developmental stages in mouse. l, Human 12 wpc cerebellum smFISH data for markers of the glutamatergic deep nuclei. The locations of the regions expanded at the right are shown with rectangles on the whole section at the left. Black arrows indicate SLC17A6-positive glutamatergic deep nuclei neurons. Pink arrow indicates EOMES-positive unipolar brush cell. Insets (dashed line) show close-ups of individual cells. LMX1A, a marker of glut_DN_P is detected in a minority of glutamatergic deep nuclei neurons (1); glutamatergic deep nuclei neurons expressing GABRA2, enriched in glut_DN_maturing cells, dominate the NTZ at 12 wpc (2). m, Detection of cells co-expressing SLC17A6 and SLC5A7 in the human 12 wpc cerebellum by smFISH. One multiplexed smFISH experiment was performed. glut DN, glutamatergic deep nuclei neurons; isth N, isthmic nuclei neurons; P, posterior; V, ventral.

