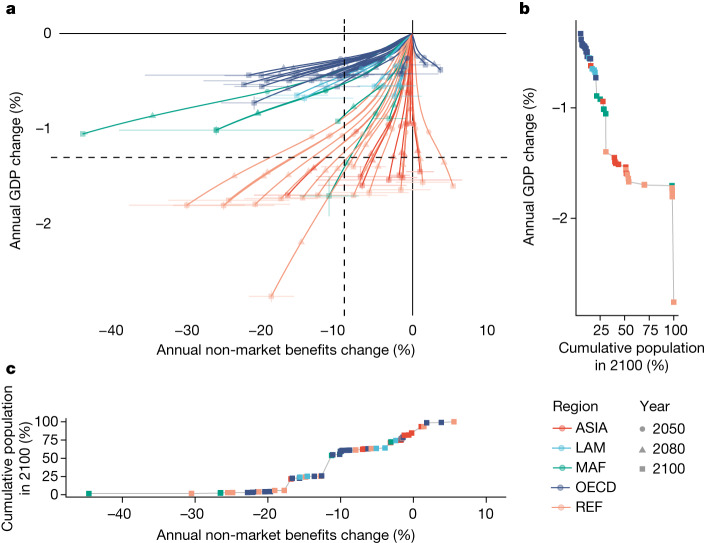
Fig. 4. Market and non-market impacts under the SSP2-6.0 scenario.
a, Trajectories of the annual change in market benefits (shown as annual GDP change) and non-market benefits are shown for the 57 countries and regions in RICE50+ with respect to simulations without climate-change impacts, from now up to 2100. Error bars show the standard errors of the estimated damage functions under different GCM outputs. Dashed lines show the population-weighted mean values in 2100. A comparison of these results for different DGVMs with region labels is presented in Extended Data Fig. 8. b, Cumulative global population plotted against respective levels of annual GDP change in 2100. c, Cumulative global population plotted against respective levels of annual non-market benefits change in 2100. The five regions are: ASIA, Asian countries except the Middle East, Japan and the former Soviet Union states; LAM, Latin America and the Caribbean; MAF, the Middle East and Africa; OECD, the OECD 90 countries and the European Union member states and candidates; REF, the reforming economies of Eastern Europe and the former Soviet Union.

