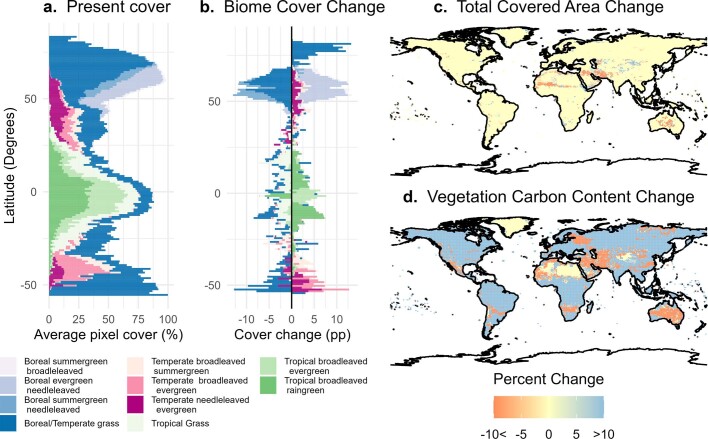
Extended Data Fig. 5. Biome shifts and changes in area cover and vegetation carbon content for the ORCHIDEE-DGVM model.
a, Average percentage of grid cell covered by different biomes in the present (2016–2020). b, Change in coverage under 2 °C warming projections relative to present day (using different GCMs and RCPs). c, Changes in fraction of grid cells covered by natural vegetation. d, Changes in carbon vegetation content (kilograms per square metre). Model output from ORCHIDEE-DGVM under two warming scenarios (RCP2.6 and RCP6.0) and two climate model outputs (GFDL-ESM2M and IPSL-CM5-LR).

