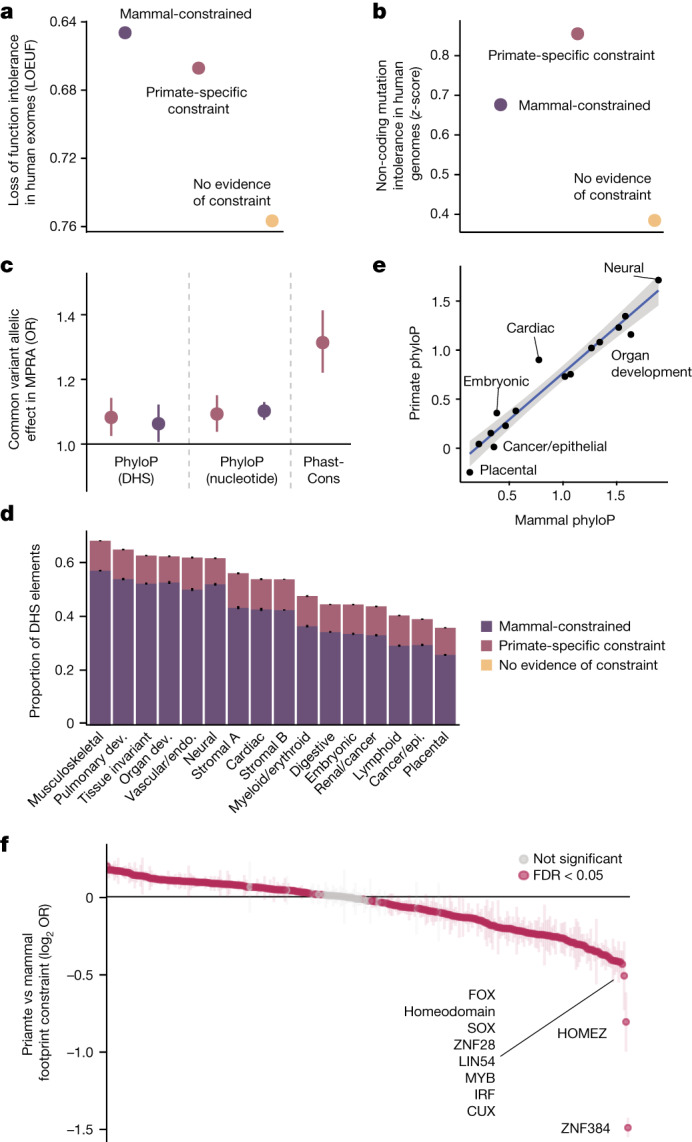
Fig. 3. Characterization of constrained regulatory elements.

a, Predicted target genes have fewer loss-of-function mutations in humans than expected at constrained DHS elements. Error bars represent 95% confidence intervals. b, Constrained DHS elements have fewer mutations in human populations than unconstrained elements. Error bars represent 95% confidence intervals. c, Enrichment of allele-specific regulatory activity (MPRA) for 27,023 common variants, stratified by type of constraint. A colour legend for constraint categories is shown in d. Error bars represent 95% confidence intervals, the central dot represents point estimates; n = 27,023 variants. d, Proportion of constrained DHS elements across 16 broad cellular contexts. Error bars represent 95% confidence intervals, centre represents proportion. n = 1,029,688 DHS elements. Dev., development; endo., endothelial; epi., epithelial. e, Scatter plot of mean primate and mammal phyloP scores at DHS elements, stratified by cell types. A linear fit is shown with a corresponding 95% confidence interval ribbon. Putative outlier cell types with higher primate phyloP than mammal phyloP scores are indicated. f, Differences in the proportion of primate and mammalian constrained footprints in human DHS elements, for each of 283 transcription factor family motifs. Positive values indicate a higher proportion of constrained TFBSs in primates, negative values indicate a lower proportion of constrained TFBSs in primates. Transcription factors that are the least constrained in primates compared to mammals are labelled, and significantly different transcription factors are coloured in magenta (FDR < 5%). Error bars represent 95% confidence intervals.
