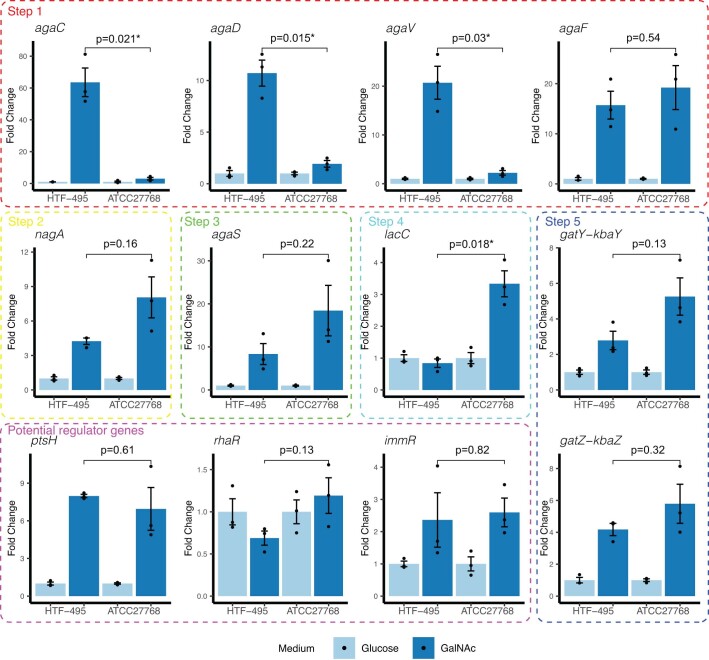
Extended Data Fig. 8. Comparison of GalNAc-induced expression fold changes in GalNAc genes between HTF-495 and ATCC27768.
Bar plots represent the average fold changes of gene expression induced by GalNAc compared to glucose induction. Each dot represents a sample, and the bar indicates the standard error of three replicates. The light blue and dark blue bars represent the expression fold change of glucose induction and GalNAc induction in relation to glucose induction, respectively. Thus, the fold change in glucose was set to 1. Unadjusted P-values estimated using the two-sided t-test are given for each gene. * Indicates a difference significant at unadjusted P < 0.05 level.

