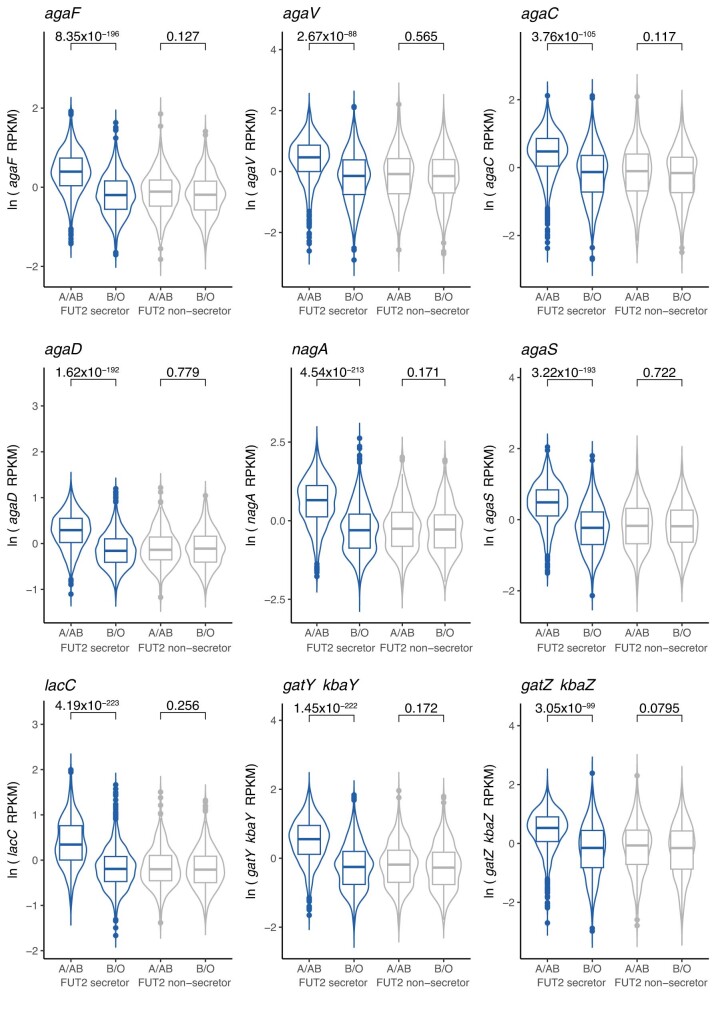
Extended Data Fig. 9. Association of nine key GalNAc pathway genes with A-antigen presence in FUT2 secretors and non-secretors.
Y-axis of the violin plots is the gene abundance in the DMP cohort (n = 1868, 2496, 610 and 760 for FUT2 secretor A/AB, FUT2 secretor B/O, FUT2 non-secretor A/AB and FUT2 non-secretor B/O, respectively). The RPKM value of gene abundance (number of reads per kilobase of transcript per million reads mapped) was profiled using ShortBRED. The y-axis unit ln(RPKM) stands for normalized gene abundance after ln(RPKM + 1) transformation, adjusted for covariates (age, sex, total read number, species abundance and the five F. prausnitzii SVs associated with ABO). The violin plots for FUT2 secretors are colored in blue. Plots for FUT2 non-secretors are in gray. Violin plots show density distribution, while the inner boxplots represent summary statistics: the center line is the median, the box hinges are the lower and upper quartiles of the distribution, whiskers extend no further than 1.5× interquartile range from the hinges, and data beyond the end of the whiskers are outliers plotted as individual points. Unadjusted P-values show the significance of the association between the ABO blood group and gene abundance while adjusting for covariates estimated using linear mixed models.

