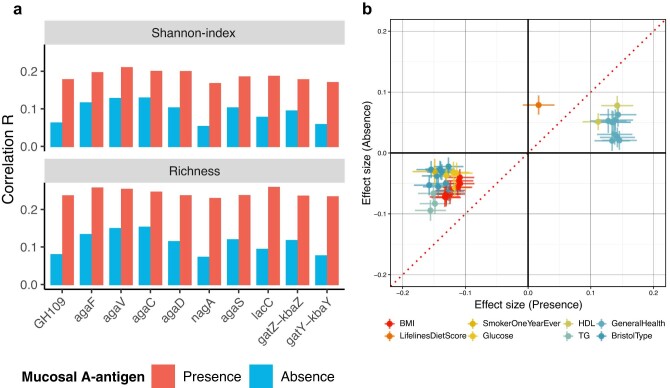
Extended Data Fig. 10. Association of GalNAc pathway genes with gut microbiome diversity and host phenotypes.
a, Community-level GalNAc utilization capacity is positively associated with gut microbiome diversity and richness. Bar plot shows the Spearman correlation coefficients (R) between the abundance of GalNAc genes in a microbial community with the alpha diversity (Shannon index) (top panel) and richness (bottom panel) of the community for individuals with (red, n = 1,868) and without (blue, n = 3,866) mucosal A-antigen. Y-axis is the Spearman correlation coefficient. X-axis indicates different GalNAc genes. b, Heterogeneity of associations between gut microbial GalNAc utilization genes and human phenotypes in individuals with and without mucosal A-antigen. Scatter plot shows the association effect size (standardized beta-coefficient from linear regression) between GalNAc metabolism gene abundance and host phenotypes in individuals with mucosal A-antigen (x-axis) and those without (y-axis). Error bars indicate the confidence interval of the beta-coefficient estimation. The associations between GalNAc metabolism gene abundance and host phenotypes are significantly higher in individuals with mucosal A-antigen (n = 1,868) compared to those without (n = 3,866) (Unadjusted Pheterogeneity < 0.05; Cochran’s Q test). Dots are colored differently for different phenotypes.

