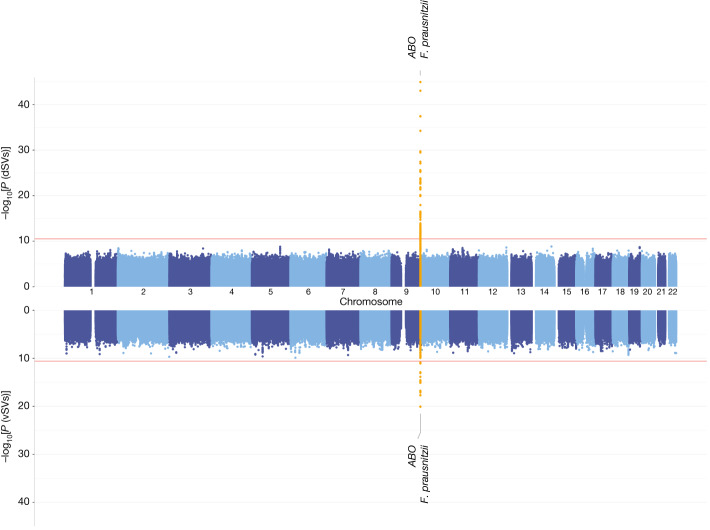
Fig. 2. A Manhattan plot of genome-wide associations of human SNPs and gut microbial SVs.
GWAS results for dSVs (top) and vSVs (bottom). The x axis shows the genomic position on the human chromosomes (chromosomes 1–22) for both the top and bottom panels. The y axes in both panels show statistical significance as −log10[P] estimated using a linear mixed model by fastGWA. The plotted P values are not adjusted for multiple testing. The red horizontal lines indicate the study-wide significance cutoffs determined using the Bonferroni method: 3.00 × 10⁻¹¹ for dSV and 2.65 × 10⁻¹¹ for vSV associations. Significantly associated loci are highlighted in yellow and labelled with the nearby human gene and the corresponding species name.

