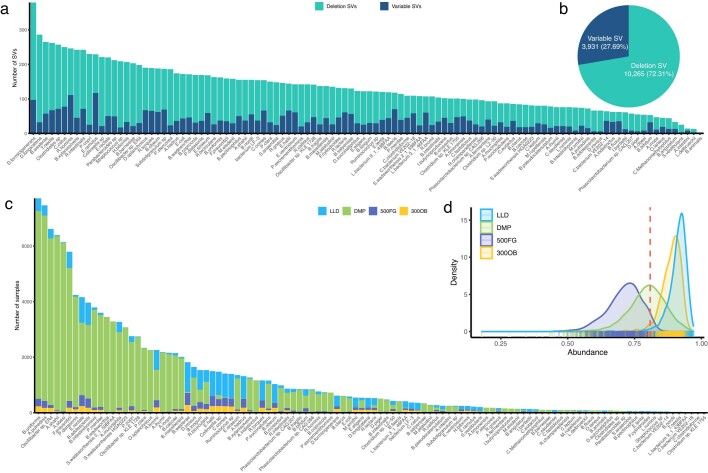
Extended Data Fig. 1. Overview of gut microbial SVs detected in the Dutch cohorts before filtering.
a, Number of dSVs and vSVs detected per species. Each bar represents a species, and the y-axis shows the number of SVs detected per species. The number of dSVs and vSVs are colored in green and blue, respectively. b, Percentages of the overall number of dSVs and vSVs detected. Pie chart shows the number of dSVs and vSVs and the corresponding proportions. c, Number of samples with detected SVs per species, colored by cohort. X-axis indicates the different species. Y-axis indicates the number of samples with detectable SVs in that species, colored by different cohorts. d, Distribution of the total relative abundance of species detected with SVs per cohort. X-axis is the total abundance in terms of proportion of a microbial community. Y-axis is density. The red dashed vertical line indicates the average total relative abundance of species with sufficient coverage to detect SVs in all Dutch samples.

