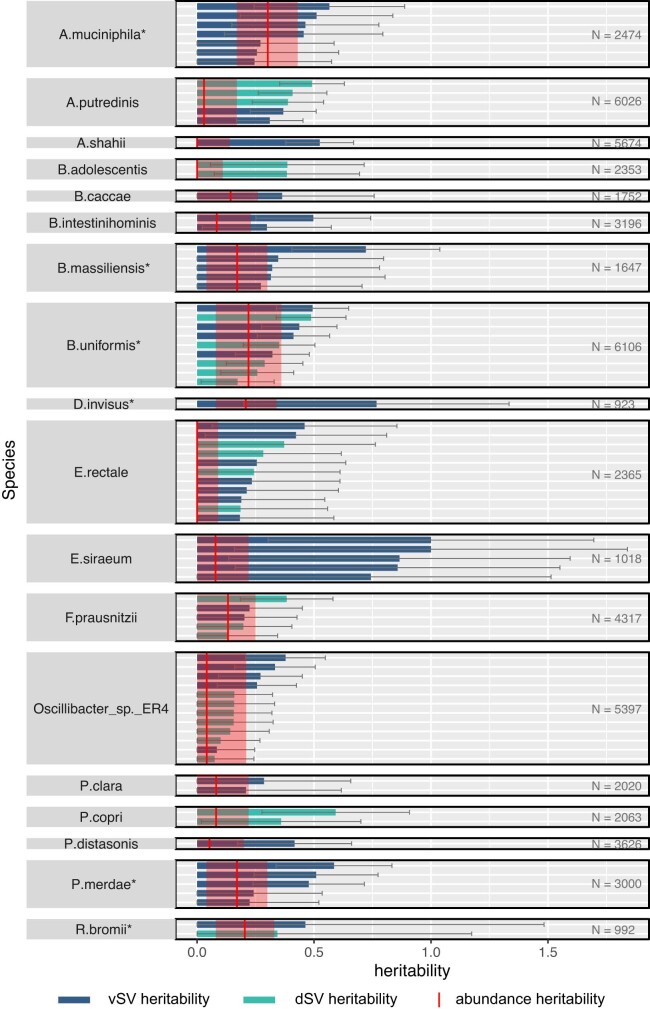
Extended Data Fig. 2. Heritability of gut microbial SVs and corresponding species abundance.
Bar height indicates heritability h2 values for vSVs (blue) and dSVs (cyan) that are nominally significant (P < 0.05), estimated using GCTA. Error bars in gray are the 95% confidence intervals (1.96 × standard error) of the estimated heritability. Solid red vertical lines indicate the heritability of the corresponding species abundance previously reported in Gacesa et al. Nature (2020), and the red opaque rectangles indicate the corresponding 95% confidence interval. Species names marked with * indicate those with significant abundance heritability at P < 0.05 level. The number of samples used for SV heritability estimation is given on the right.

