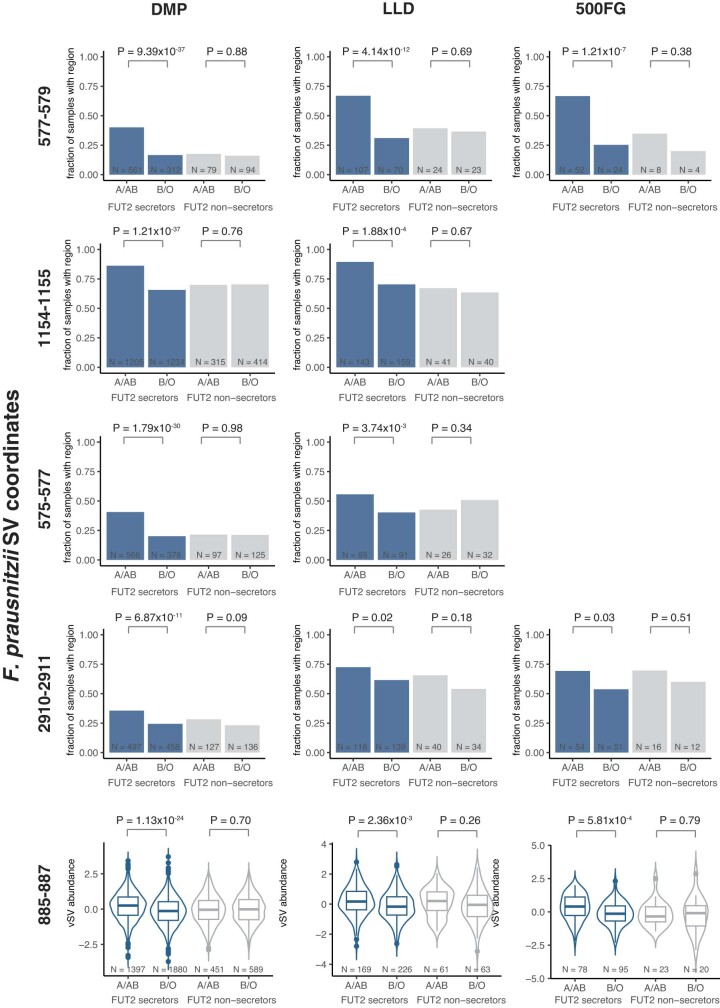
Extended Data Fig. 4. The associations of F. prausnitzii SVs with ABO blood groups depend on FUT secretor status.
Each row of panels represents a different SV region. Each column of panels represents a different cohort. The associations of dSVs are visualized using bar plots where the y-axis shows the fraction of samples with the dSV region. Number of samples for each group is given at the bottom of each bar. The associations of vSVs are visualized using violin plots where the y-axis shows the standardized coverage of vSVs. Violin plots show density distribution, whereas the inner boxplots represent summary statistics: the center line is the median, the box hinges are the lower and upper quartiles of the distribution, the whiskers extend no further than 1.5× interquartile range from the hinges, and data beyond the end of the whiskers are outliers plotted as individual points. The x-axis of all plots shows the ABO blood group (A/AB or B/O) split by FUT2 status. Unadjusted P-values show the significance of the association estimated using linear mixed models.

