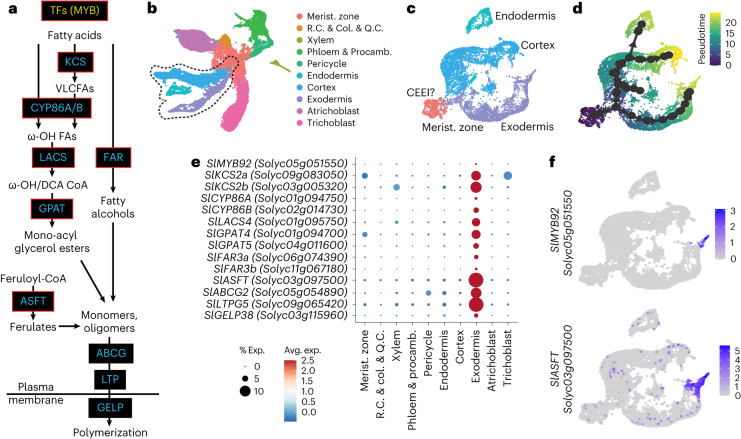
Fig. 2. The tomato suberin biosynthetic enzymes and transcriptional regulator are expressed in the mature exodermis.
a, Simplified diagram of the suberin biosynthesis pathway. Boxes indicate gene families involved in each step of the pathway (blue and yellow indicate biosynthetic enzymes and transcriptional regulators, respectively). Genes targeted in this study are outlined in red. TFs, transcription factors; VLCFAs, very-long-chain fatty acids. b, Annotated single-cell clusters from 3 cm of the tomato root tip displayed by an integrated UMAP. R.C., root cap. Q.C., quiescent centre; col, columella; procamb, procambium. c, UMAP of cortex/endodermis/exodermis-annotated cells that were extracted from the general projection and re-embedded. A small cluster of cells from the meristematic zone clusters were included to help anchor pseudotime estimations. CEEI, cortex–exodermis–endodermis initial. d, A pseudotime trajectory analysis for the cortex/endodermis/exodermis cell populations. e, Cell type or tissue-specific expression profiles for suberin biosynthetic pathway genes. Dot diameter represents the percentage of cells in which each gene is expressed (% Exp.) and colours indicate the average scaled expression of each gene in each developmental stage group with warmer colours indicating higher expression levels. f, Expression of SlMYB92 and SlASFT in the single-cell transcriptome data. The colour scale represents log2-normalized corrected UMI counts.

