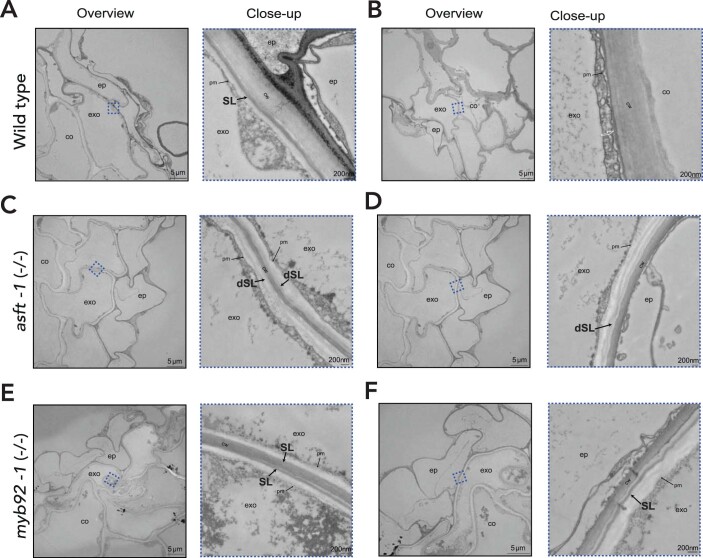
Extended Data Fig. 1. Suberin deposition and ultra-structure in tomato exodermal cells.
Transmission electron microscopy cross-sections of 7-day-old wild type (a-b), asft-1 (c-d) and myb92-1 (e-f) plants obtained at 1 mm from the root-hypocotyl junction. Overview images show the epidermal, exodermal and inner cortex layers. Close-up images (corresponding to the zones defined with blue dashed lines in the adjacent Overview images) show the presence or absence of suberin lamellae. Black arrows indicate the presence of suberin lamellae, white arrow indicates areas where suberin lamellae could not be detected. scale bars = 5 µm for overview and 200 nm for close-up. Close-ups of c & f are repeated in Fig. 3. co = cortex, exo = exodermis, ep = epidermis, SL = suberin lamellae, dSL = defective suberin lamellae, cw = cell wall, pm = plasma membrane.

