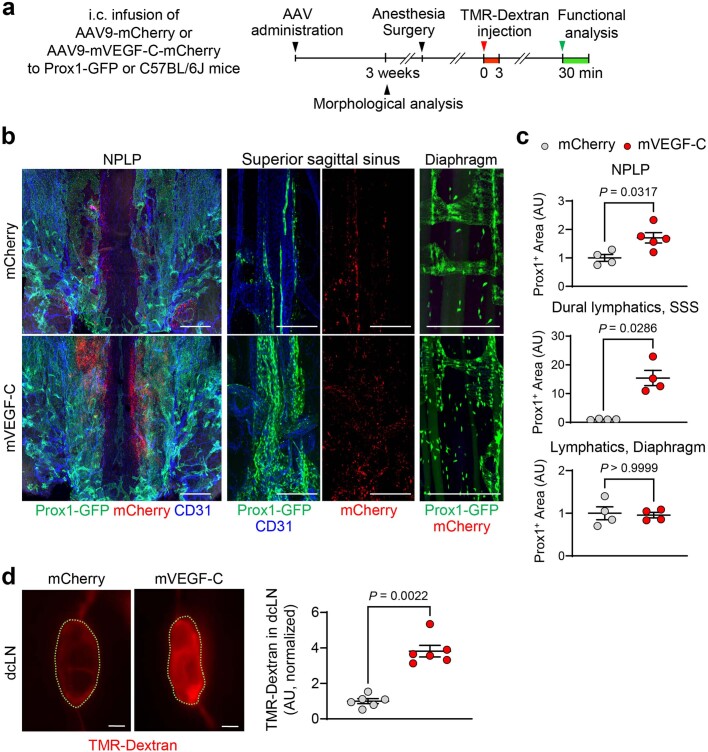
Extended Data Fig. 8. Intracisternal AAV-mVEGF-C delivery expands nasopharyngeal lymphatic plexus and increases CSF outflow to deep cervical lymph nodes.
a, Diagram of the experimental sequence of intracisternal (i.c.) infusion of 3 × 10¹⁰ genome copies of AAV9-mCherry (mCherry) or AAV9-mVEGF-C-mCherry (mVEGF-C) in 3 μl of PBS, followed by i.c. infusion of TMR-Dextran at 1.0 μl/min for 3 min at 3 weeks later and measurement of TMR-Dextran fluorescence in deep cervical lymph nodes (dcLN) 30 min later in Prox1-GFP or C57BL/6J mice. b,c, Immunofluorescence images of tissue whole mounts stained for mCherry (red) and CD31 (blue) and area measurements comparing Prox1+ lymphatics in the NPLP, dura along the superior sagittal sinus (SSS), and diaphragm after delivery of mCherry or mVEGF-C. The similarity of mCherry expression in the NPLP and SSS of both groups is evidence that the AAV9-vectors were similarly transduced to these tissues. Scale bars, 500 μm (NPLP) and 200 μm (SSS, diaphragm). Each dot is the value for one mouse; Prox1+ area of the NPLP (mCherry, n = 4; mVEGF-C, n = 5), Prox1+ area of the dural lymphatics of SSS (n = 4 mice/group), Prox1+ area of diaphragm (n = 4 mice/group), TMR-Dextran intensity in dcLN (n = 6 mice/group) in three independent experiments. Bars indicate mean ± s.e.m. AU (arbitrary unit) normalized to control mean. P values were calculated by two-tailed Mann-Whitney test. d, Fluorescence images and measurements comparing TMR-Dextran fluorescence in deep cervical lymph nodes (dcLN, outlined by green dashed lines) in mice treated with mCherry or mVEGF-C. Scale bars, 200 μm. Each dot is the value for one mouse; n = 6 mice/group in three independent experiments. Bars present mean ± s.e.m. AU, arbitrary unit, normalized to mCherry mean. P values were calculated by two-tailed Mann-Whitney test.

