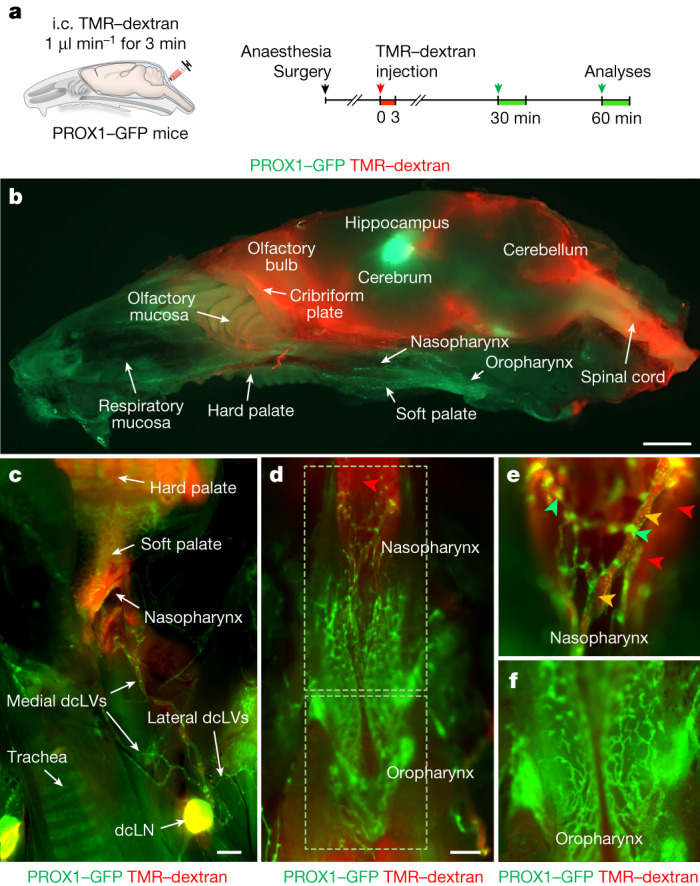
Fig. 2. Preferential and selective distribution of TMR–dextran in the head and neck after intracisternal infusion.

a, Diagram of the experimental sequence for intracisternal (i.c.) infusion of TMR–dextran (molecular mass, 10 kDa) into Prox1-GFP mice through the cisterna magna at 1.0 μl min−1 for 3 min followed by analysis of the distribution of TMR–dextran in the head and neck 30 or 60 min later. b, Fluorescence image showing the distribution of TMR–dextran in a mid-sagittal view of half of the head and neck at 60 min after intracisternal infusion. The PROX1–GFP signal is strong in the hippocampus and in the lymphatics in the nasopharynx, oropharynx and palate. Scale bar, 2 mm. Similar findings were obtained from n = 6 mice in three independent experiments. c–f, Fluorescence images showing the distributions of TMR–dextran in the indicated regions of dissected neck at 30 min after intracisternal infusion. TMR–dextran fluorescence (red) is strong in medial dcLVs, dcLNs (c) and lymphatic plexus in the nasopharynx (yellow arrowheads) (d,e) but not in the oropharynx (f). Strong PROX1+ lymphatic valves are indicated by green arrowheads. The red arrowheads indicate the background signal emitted from the skull base. Scale bars, 1 mm (c) and 500 μm (d). Similar findings were obtained from n = 10 mice in five independent experiments.
