
Fig. 7. Slowed CSF outflow through the medial deep cervical lymphatics in aged mice and ageing-related transcriptomic changes in LECs of the NPLP.
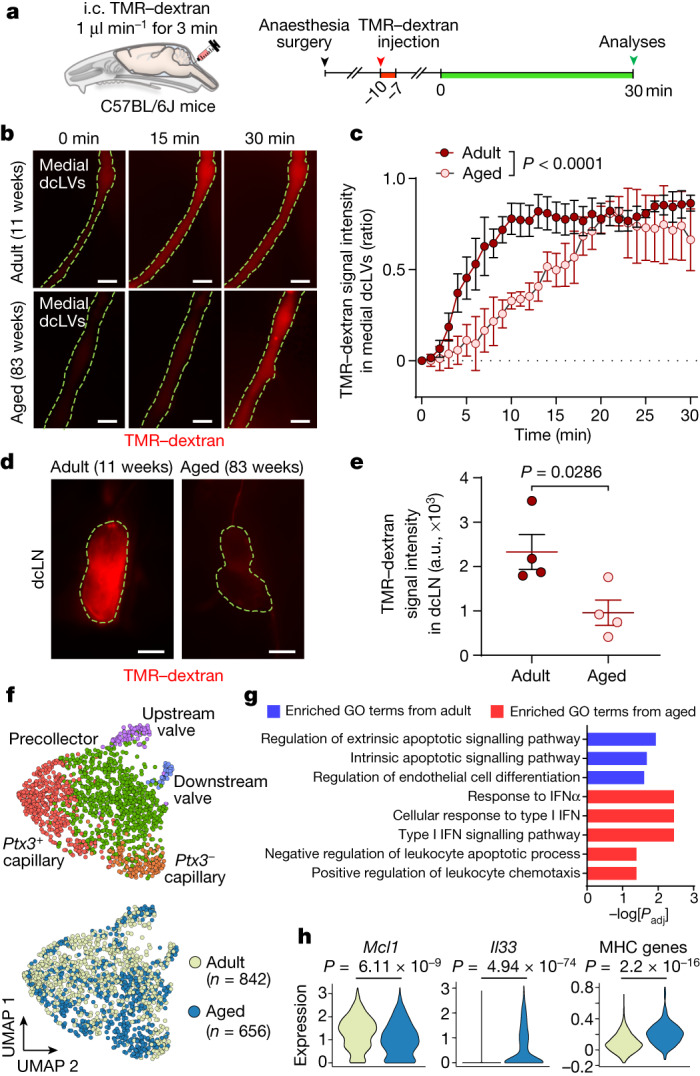
a, Diagram of the location and the experimental sequence of intracisternal infusion of TMR–dextran at 1.0 μl min−1 for 3 min followed by measurement of TMR–dextran fluorescence in the medial deep cervical lymphatics (medial dcLVs) and dcLNs over 30 min by intravital imaging in C57BL/6J mice. b–e, Fluorescence images (b,d) and measurements (c,e) comparing TMR–dextran fluorescence in the medial dcLVs (b,c; outlined by yellow dashed lines) and dcLNs (d,e, outlined by yellow dashed lines) of adult (aged 11 weeks) and aged (aged 83 weeks) mice over 30 min after intracisternal infusion. Scale bars, 200 µm (b) and 500 µm (d). For c, data are mean ± s.e.m. for n = 4 mice per group in four independent experiments. P values were calculated using two-way repeated-measures ANOVA. For e, each dot is the value for one mouse. n = 4 mice per group in four independent experiments. a.u., arbitrary units. Data are mean ± s.e.m. P values were calculated using two-tailed Mann–Whitney U-tests. f, Uniform manifold approximation and projection (UMAP) plot visualizing five subclusters of LECs in the nasopharyngeal mucosa of adult (aged 10–12 weeks) and aged (aged 73–80 weeks) mice. The five subclusters of LECs are conserved in aged mice. The total number of LECs analysed was 1,498. g, GO analysis of the genes enriched in adult or aged mice. The list shows the top three GO terms significantly enriched in adult LECs (blue) and the top five GO terms significantly enriched in aged LECs (red). P values were calculated using the Benjamini–Hochberg correction method for multiple-hypothesis testing. h, Three example genes that were differentially expressed in adult and aged mice. P values were calculated using two-tailed model-based analysis of single cell transcriptomics (MAST) with Bonferroni post hoc test or two-tailed Wilcoxon rank-sum test.