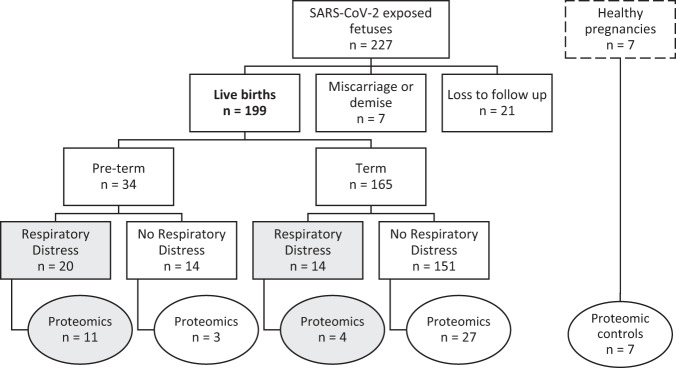
Fig. 1. Flow diagram of study participants (n = 199) included in the main analysis and proteomic sub-analysis (n = 52).
The 199 live births were included in our main statistical analysis; circles indicate the infants included in our proteomic sub analysis. Shaded boxes/circles highlight the neonates with respiratory distress. Healthy pregnancies have a dashed border to indicate that these participants were not included in our analysis.

