Fig. 6.
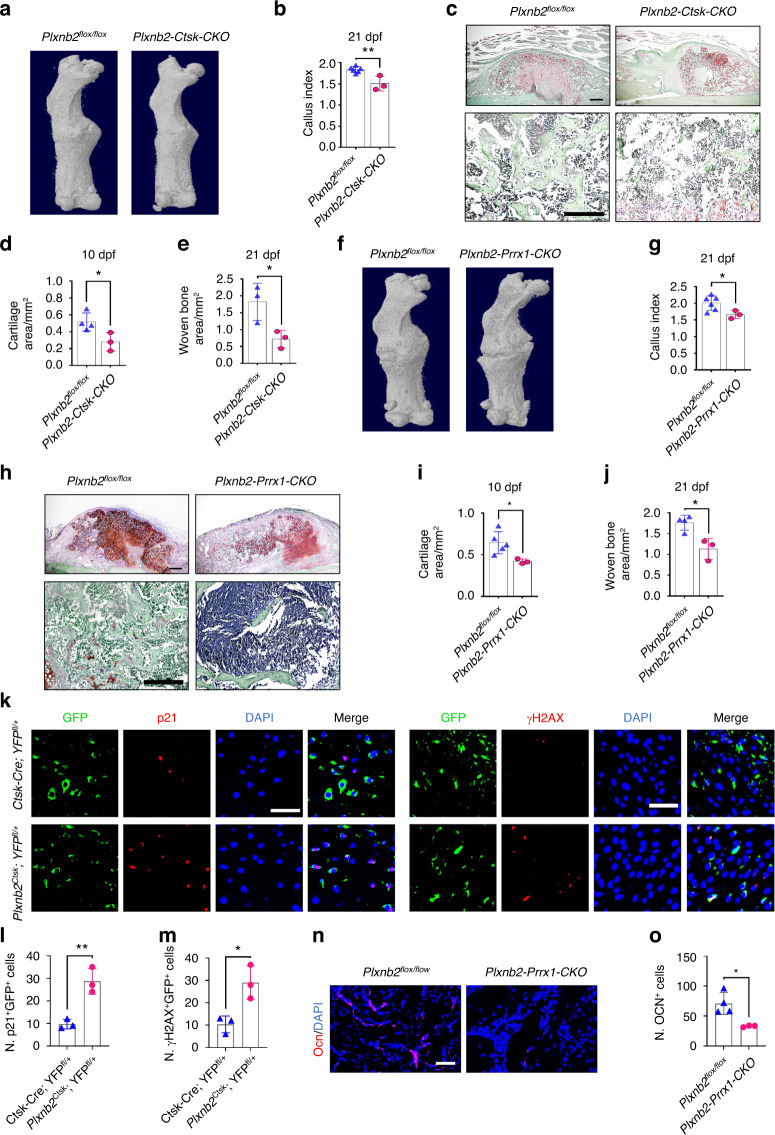
Deletion of Plxnb2 in Ctsk+ and Prrx1+ cells impairs fracture repair in adult mice. a Representative micro-CT images of fractured femurs from Plxnb2-Ctsk-CKO mice and Plxnb2flox/flox control mice at 21 dpf. b The callus index of fractured femurs from Plxnb2-Ctsk-CKO mice and Plxnb2flox/flox mice at 21 dpf (n = 3–6). c–e Safranin O staining showing cartilage callus formation and woven bone area of fractured femurs from Plxnb2-Ctsk-CKO mice and Plxnb2flox/flox mice at 10 dpf and 21 dpf (n = 3–4). Scale bar indicates 100 μm. f Representative micro-CT images of fractured femurs from Plxnb2-Prrx1-CKO mice and Plxnb2flox/flox control mice at 21 dpf. g The callus index of fractured femurs from Plxnb2-Prrx1-CKO mice and Plxnb2flox/flox mice at 21 dpf (n = 3–6). h–j Safranin O staining showing cartilage callus formation and woven bone area of fractured femurs from Plxnb2-Prrx1-CKO mice and Plxnb2flox/flox mice at 10 dpf and 21 dpf (n = 3–5). Scale bar indicates 100 μm. k Representative IF images of fracture calluses at 10 days post-fracture, immunostained with GFP (green) and p21 (red) or H2AXγ (red) antibodies and counterstained with DAPI (blue). Scale bars indicate 100 µm. l, m Quantification of the number of p21- and GFP-positive cells per mm2 tissue area (N. p21+GFP+ cells) and the number of γH2AX- and GFP-positive cells per mm2 tissue area (N. γH2AX+GFP+ cells) (n = 3). n Representative IF images of fracture calluses at 21 days post-fracture, immunostained with Ocn (red) antibodies and counterstained with DAPI (blue). Scale bars indicate 100 µm. o Quantification of the number of Ocn-positive cells per mm2 tissue area by Welch’s t-test (N. Ocn+ cells) (n = 3–4). Data are presented as the means ± SDs. Unpaired t test, *P < 0.05 and **P < 0.01

