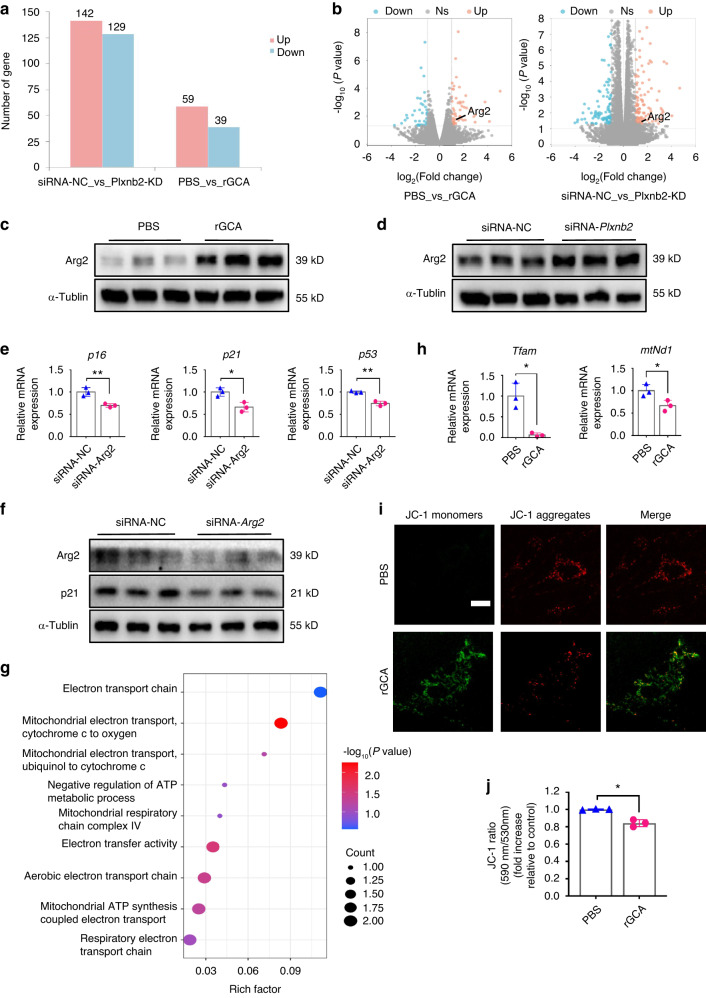
Fig. 7.
The GCA-PLXNB2 axis may promote SSPC senescence through the mitochondrial enzyme Arg2. a Statistics of differentially expressed genes in the rGCA and/or siRNA-Plxnb2 groups ( ≥ 2-fold change). b Volcano plots showing increased Arg2 expression in the rGCA and/or siRNA-Plxnb2 groups ( > 2-fold change). c, d Western blotting analysis of Arg2 protein expression in the rGCA and/or siRNA-Plxnb2 groups. e RT‒PCR analysis of senescence marker gene expression in siRNA-NC and siRNA-Arg2 SSPCs (n = 3). f Western blotting analysis of Arg2 and p21 protein expression in the siRNA-NC and siRNA-Arg2 groups. g GO analysis of differentially expressed genes related to mitochondrial function. h RT‒PCR analysis of Tfam and mtNd1 gene expression in PBS- and rGCA-treated SSPCs (n = 3). Tfam by Welch’s t test. i Fluorescence microscopy image showing the JC-1 probe in PBS- and rGCA-treated SSPCs. Scale bars indicate 20 µm. j Mitochondrial membrane potential was measured using JC1 staining by Welch’s t test. Data are presented as the means ± SDs. Unpaired t test, *P < 0.05 and **P < 0.01

