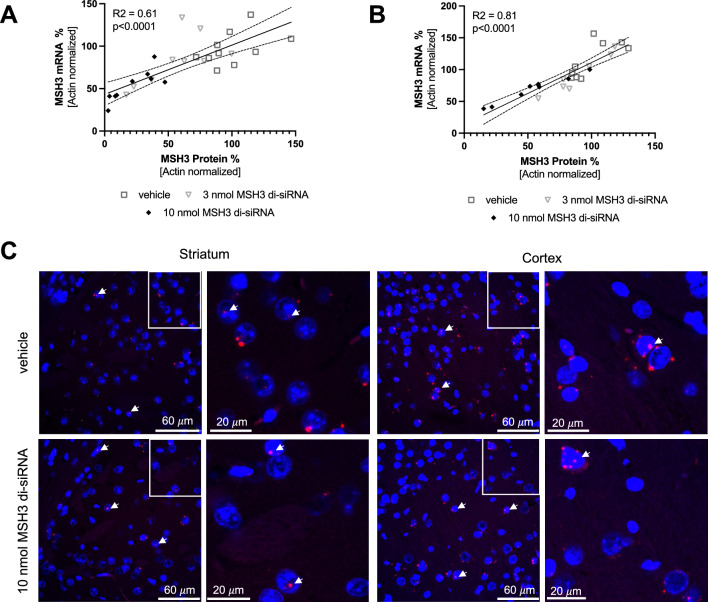
Figure 3.
Nuclear Msh3 mRNA pool that is not accessible by MSH3 di-siRNA. (A) The graph demonstrates the linear correlation between striatal MSH3 mRNA and protein levels in HdhQ111/+ mice post 10 nmol MSH3 di-siRNA treatment. The correlation coefficient (R2) is 0.61, with a Y-intercept at 43.2 and a 95% confidence interval ranging from 29.8 to 56.6 (p < 0.001). (B) The linear correlation between cortical Msh3 mRNA and protein levels is depicted, presenting a correlation coefficient (R2) of 0.81, a Y-intercept at 14.0, and a 95% confidence interval from − 3.7 to 31.6 (p < 0.001). (C) Msh3 mRNA (red) localization in striatum and cortex detected with RNAscope post vehicle and 10 nmol MSH3 di-siRNA treatment. Nuclei stained with Hoechst 33342 (blue). Arrows indicate nuclei with nuclear Msh3 mRNA. The second and fourth columns display higher magnification views of the regions outlined by white boxes in the first and third columns, respectively.

