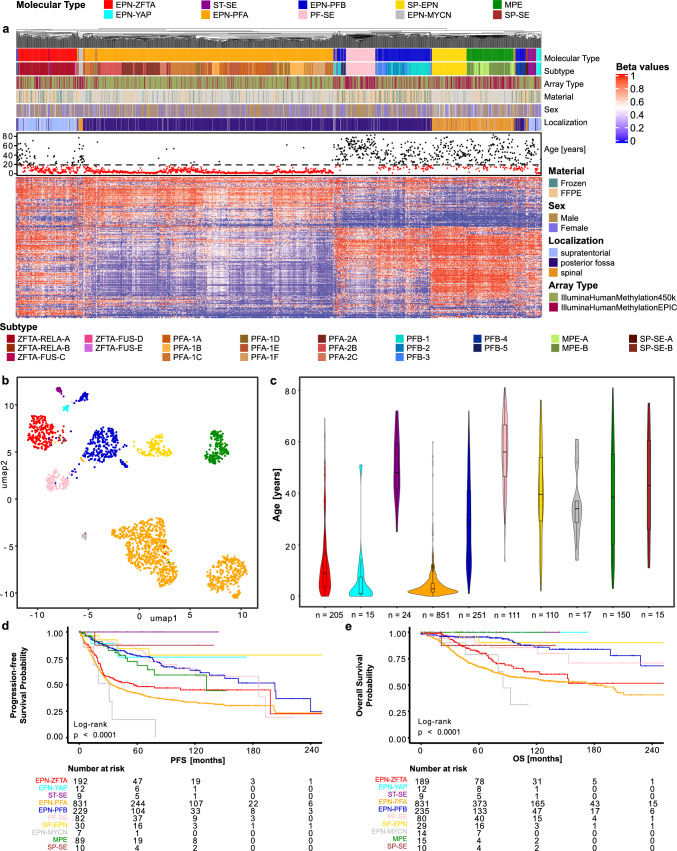
Fig. 1.
Ten molecular classes of ependymoma defined by DNA methylation-based class prediction form distinct clusters in a large new cohort. a Heatmap showing the hierarchical clustering of the DNA methylation profiles of 2023 ependymomas. Each column represents one sample, and the rows show the 10,000 most variable CpG sites. Methylated (red) and unmethylated (blue) sites (beta values) are depicted by a color scale as shown. The associated subtype, array type, material, sex, age, and localization are indicated. b Uniform Manifold Approximation and Projection (UMAP) of the ependymoma cohort samples (n = 2023) on the 10,000 most variable CpG sites. Individual samples are color-coded according to the respective molecular class as defined by random forest-based class prediction. c Violin plot showing the patient age at diagnosis across the ten molecular types. d Progression-free survival (PFS) across the ten molecular types. e Overall survival (OS) across the ten molecular types

