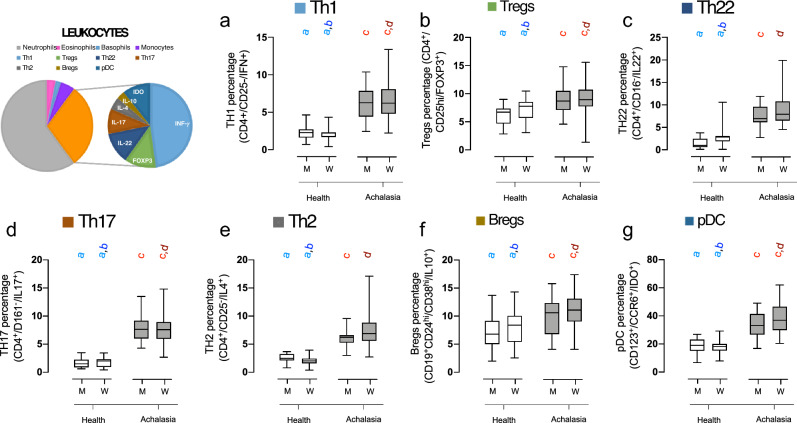
Figure 3.
Differences in lymphocyte subtypes between healthy individuals and patients with achalasia. Box and whisker plots show the median, interquartile range, and range of the percentages of fluorescence-activated cell sorting of lymphocytes in men and women with and without achalasia, identified by biomarkers. Statistical significance is summarized by levels and represented by colored letters a-d, where groups with the same letter have comparable significance levels.

