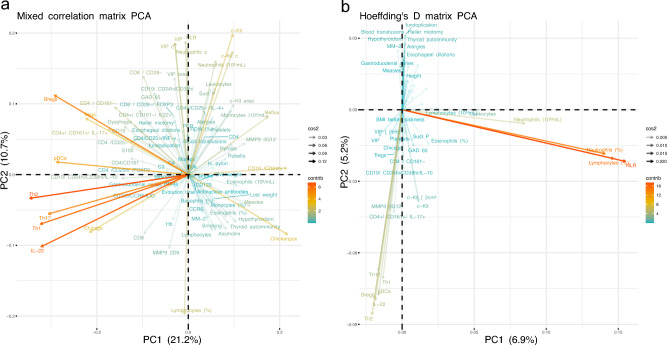
Figure 5.
Principal component analysis (PCA) loading plot. (a) PCA was performed on the mixed correlation matrix of the complete dataset, normalized by health thresholds of men and women with achalasia. (b) PCA was also applied to the Hoeffding’s D statistical dependence matrix. The color of the vector represents the contribution to the first and second principal components, where variables that highly correlated with the principal components contributed the most. The opacity of the vector shows the , the rotation of the vector, and the quality of the representation of the variable on the map.

