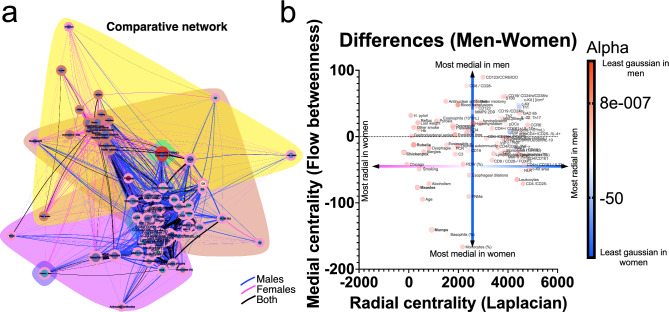
Figure 8.
Sexual differences in patients with achalasia. Networks from both sexes were superimposed, with correlations unique to women in pink, correlations only for men in blue, and correlations shared by both sexes in black (a). Clouds of color represent Louvain’s optimization clustering and node borders represent InfoMAP’s clustering. Differences in medial and radial node centrality are plotted (b). Node size shows the normalized value median and its size shows the alpha value, i.e. the distance from a normal distribution.

